An analysis of the relationship between Player Contract Amounts and Team Success in the Indian Premier League

The Indian Premier League is a salary cap league. In 2023 each team was able to spend roughly USD$11.5m (950 million rupees) for the season. A player auction is held prior to each new season with all teams bidding for player contracts. The amount the player is won for at auction is the amount they’re paid for the season. The lowest paid contracts are USD$26,000 (2 million rupees), and the highest paid contract for the 2023 season was Sam Curran from England who was paid USD$2.256m (185 million rupees). Contract length is not publicly available information however it is highlighted when a player is retained from one year to another. It can then be inferred how long the player was under contract for with contract lengths appearing to vary from 1 to 4 years, however this has not been able to be confirmed.

The aim of this article was to investigate whether there is any correlation between money spent on player contracts in the Indian Premier League, and winning. I acknowledge that winning may not be the only consideration given to how much teams bid on a player – marketing may also play a part. Contract information was available for 7 seasons from 2017-2023, therefore this was the time period used for this analysis.

Scatter plot using team logos comparing scaled team salary amounts, and their winning percentage

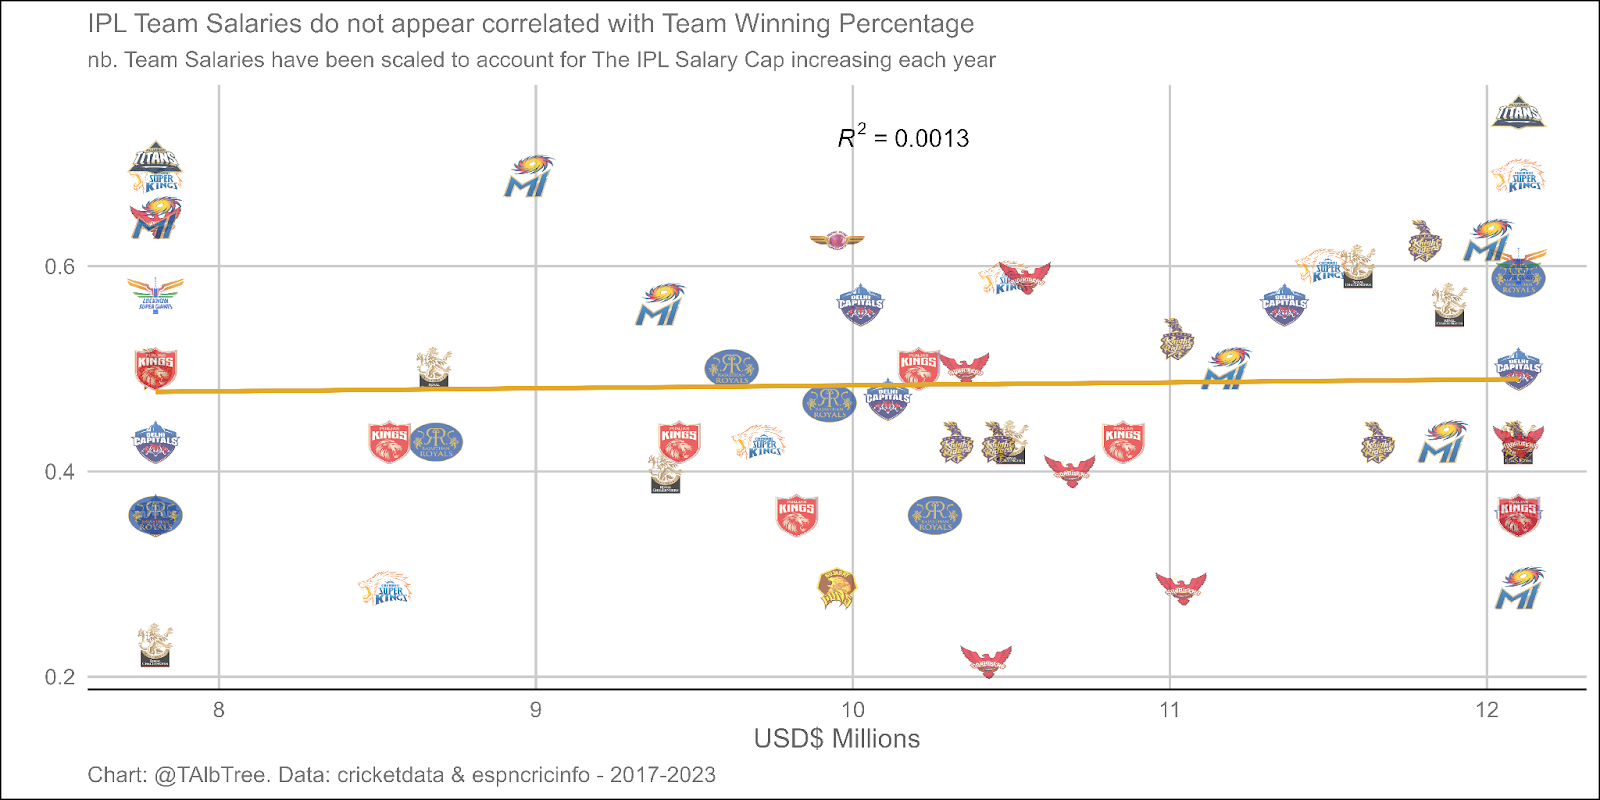
At a team level, the amount spent on Player Contracts does not appear to be correlated with Team Winning Percentage. This is what a salary cap in any league should be trying to achieve, parity across payrolls.

Density chart of indian premier league salaries

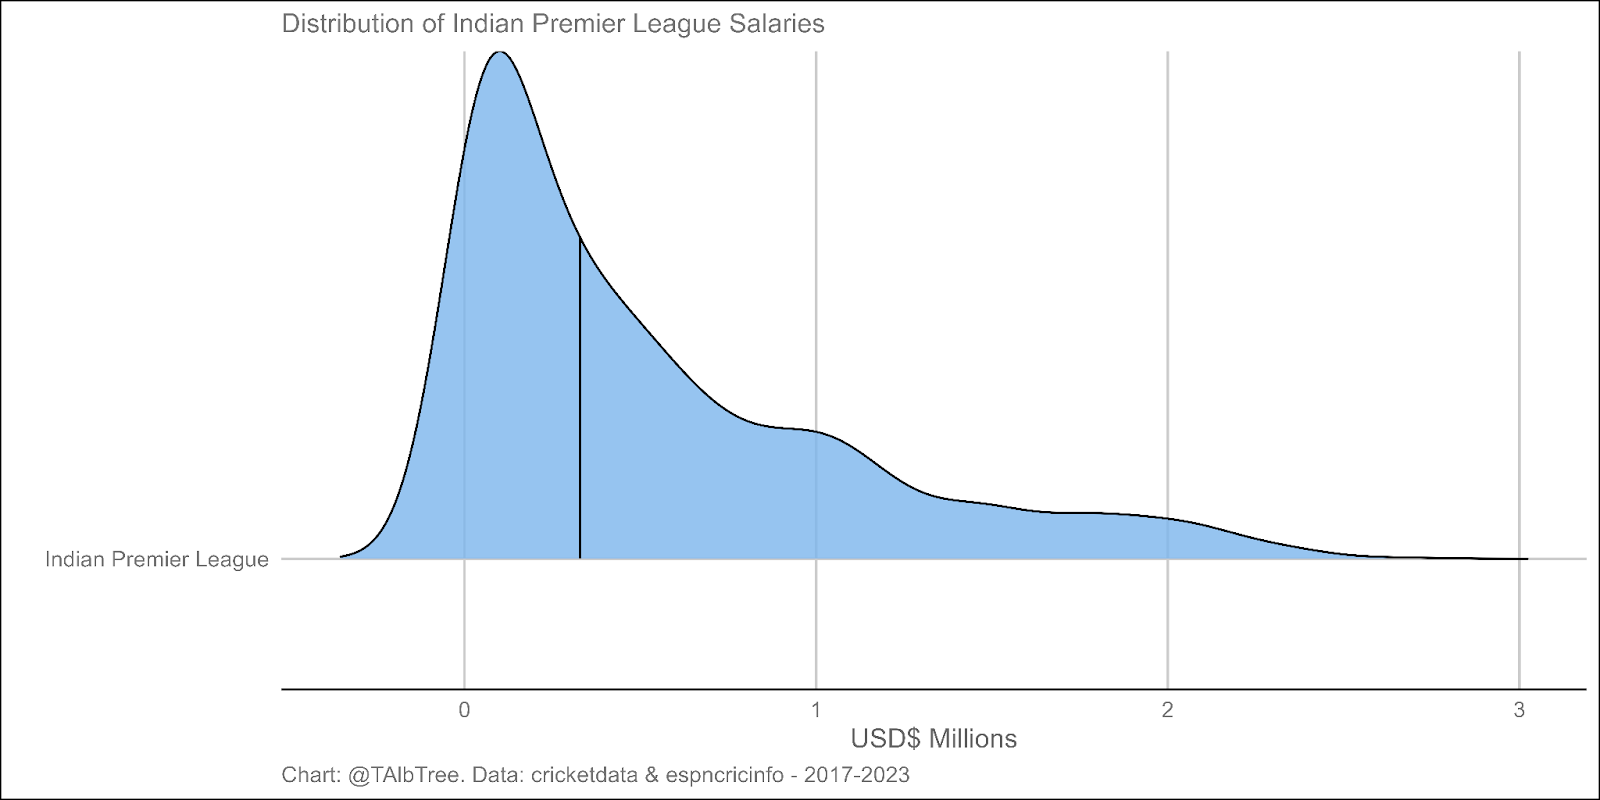
Indian Premier League contracts are heavily positively skewed – the median contract costing $328,000USD, and the mean contract costing $537,000USD.

Beeswarm plot of salary amounts for the indian premier league. All Rounder and Bowlers skewed towards cheaper contracts.
Density plots of indian premier league salaries - bowlers cheapest. Batter/wicket keeper and wicket keeper have the longest tail

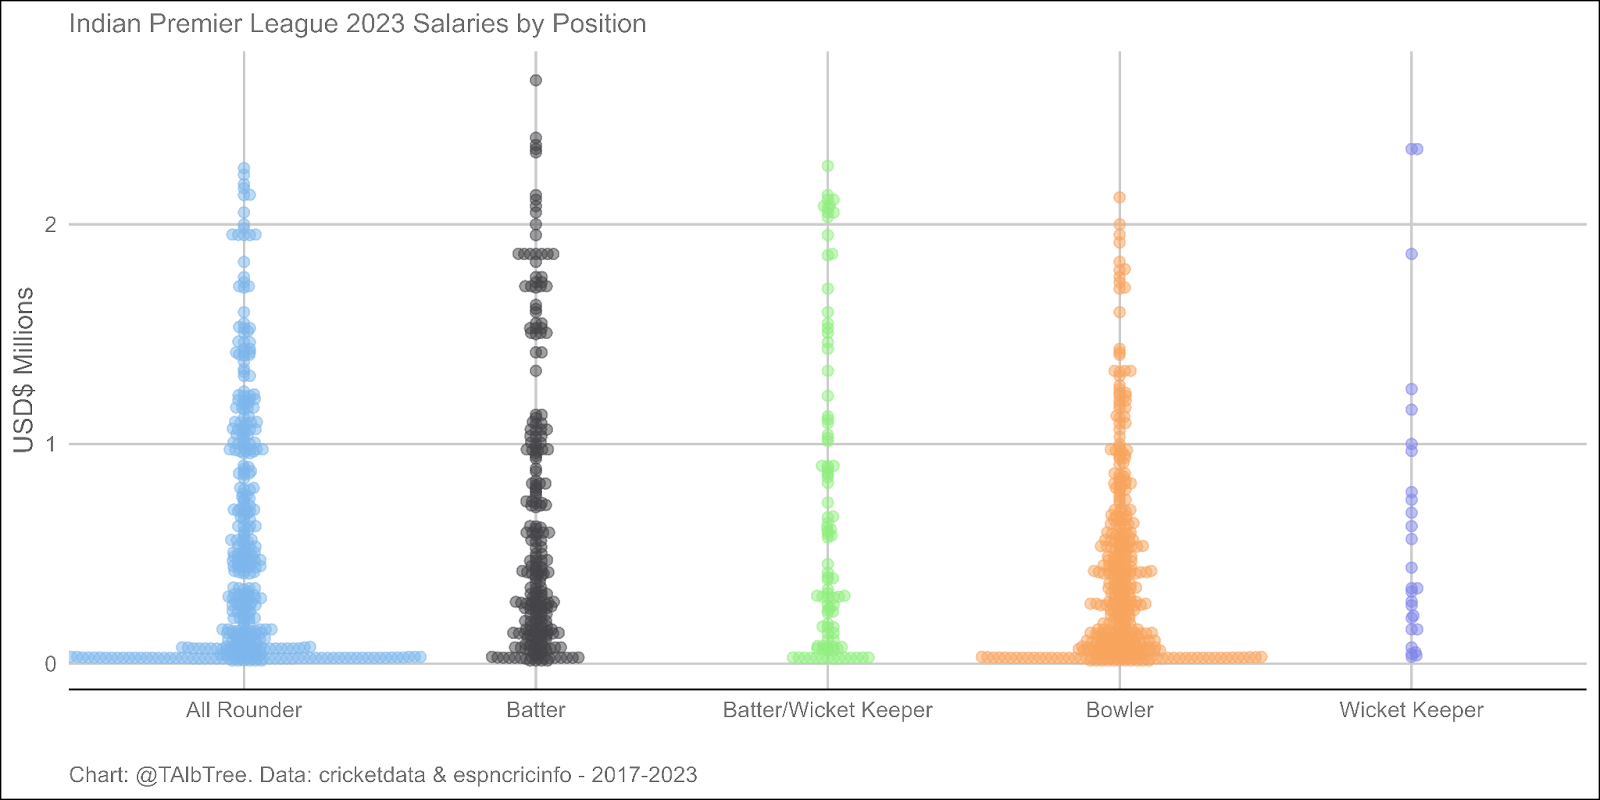
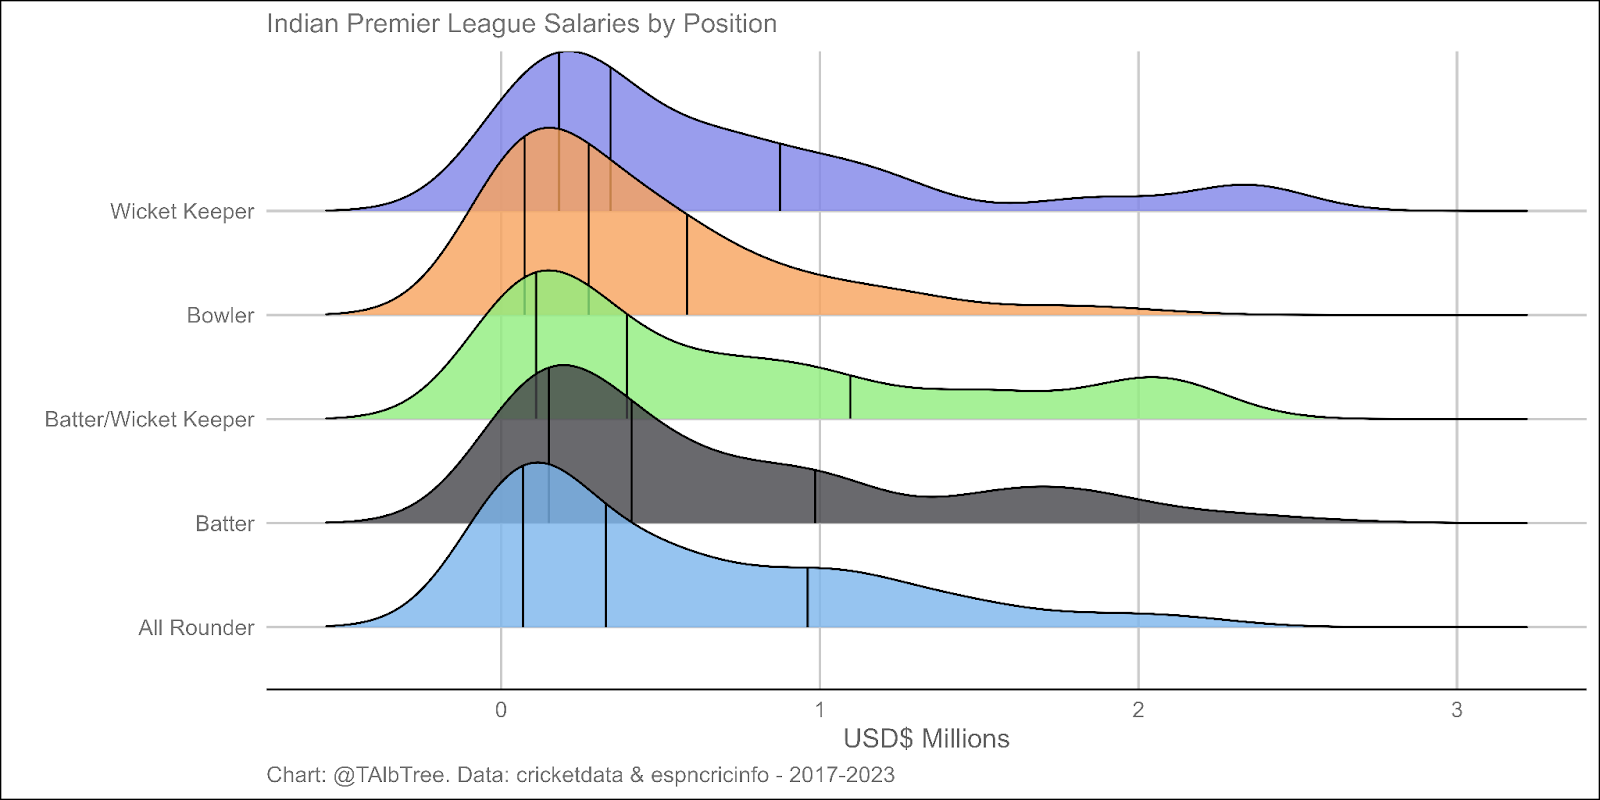
The above two plots both represent the same information, but in two different visualisations: Indian Premier League contract amounts by position. My main takeaway here is how much more densely populated the Bowler contracts are. The median contract for Bowlers is $275,000USD compared to $388,000USD for non-Bowlers. What’s more shocking is when comparing 75th percentile contracts: $583,000 for Bowlers, compared to $975,000 for Non-Bowlers. This presents two questions for me:

  1. What contributes more to winning games: Bowling or Batting?
  2. Is bowling contract amount correlated with performance?

To quote Wikipedia: Win probability added (WPA) is a sport statistic which attempts to measure a player’s contribution to a win by figuring the factor by which each specific play made by that player has altered the outcome of a game. In the sense of Twenty20 cricket – at each ball during the game the win probability can be calculated by applying a model. Win probability added is the difference between the win probability prior to a ball being bowled, and prior to the next ball being bowled. This can then be evenly split to Batting WPA, and Bowling WPA. Other factors such as fielder position, and skill, are also likely to play a part in Win Probability Added, however current open source Ball by Ball data does not include fielding information. Win Probabilty accounts that a wicket, or runs, at one point in the game, does not have the same impact on a team’s likelihood to win a game, as it does at another point in the game. A wicket, or a boundary (4 runs or 6 runs) early in an innings, usually is less impactful than latter in an innings, as the opponent still has lots of time to adjust for the new information provided by that event, whereas later in the game, there is less opportunity to make up for that event.

Scatter plot of batting and bowler win probability added vs team win percentage for the five major Twenty20 competitions: Indian Premier League, Big Bash, Vitality Blast, SA20, Super Smash League.
Scatter plot of batting and bowler win probability added vs team win percentage for the Indian Premier League

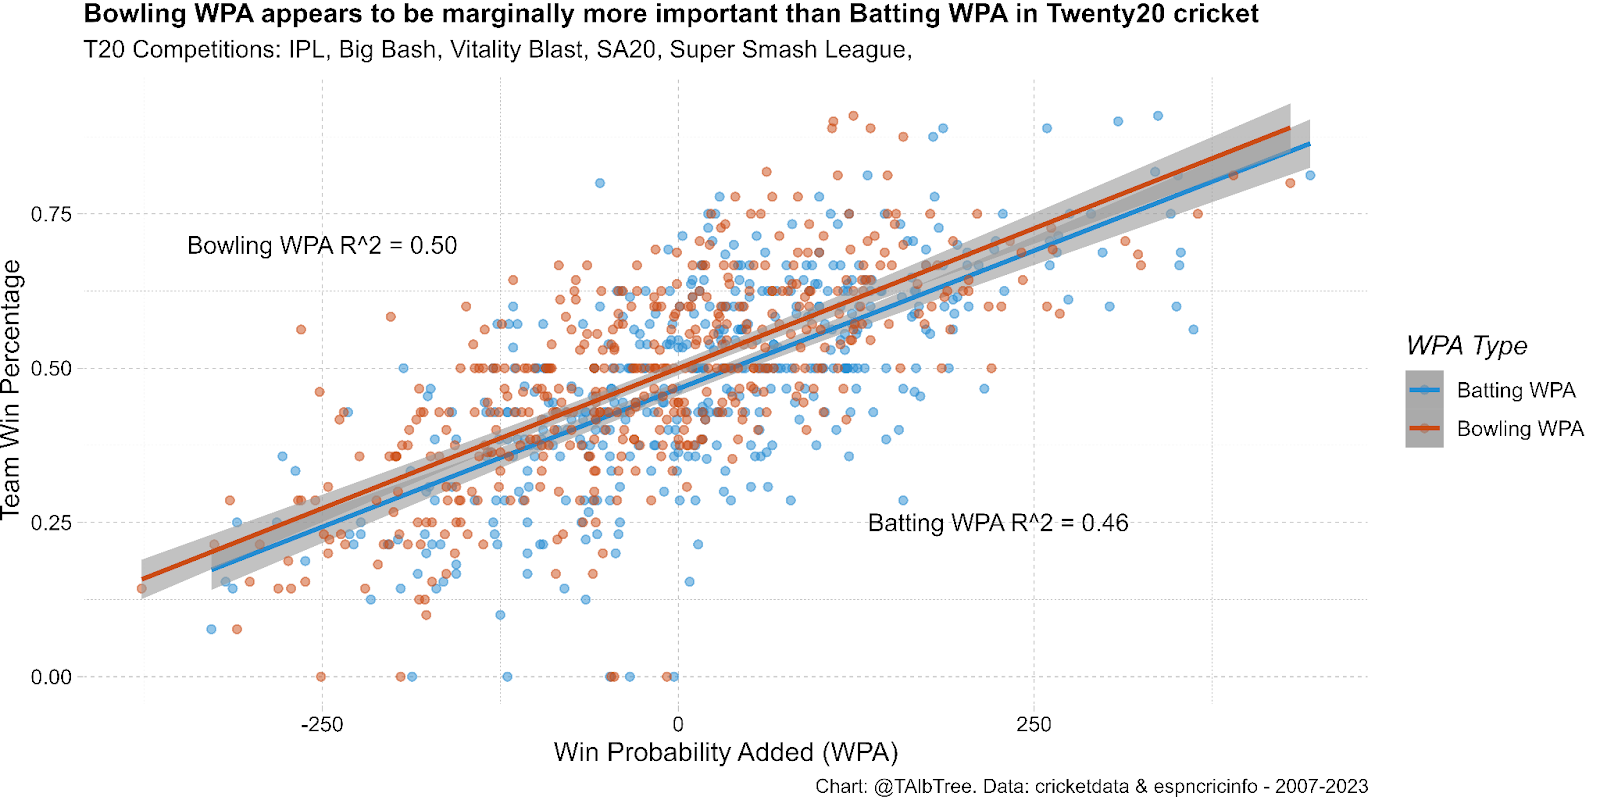
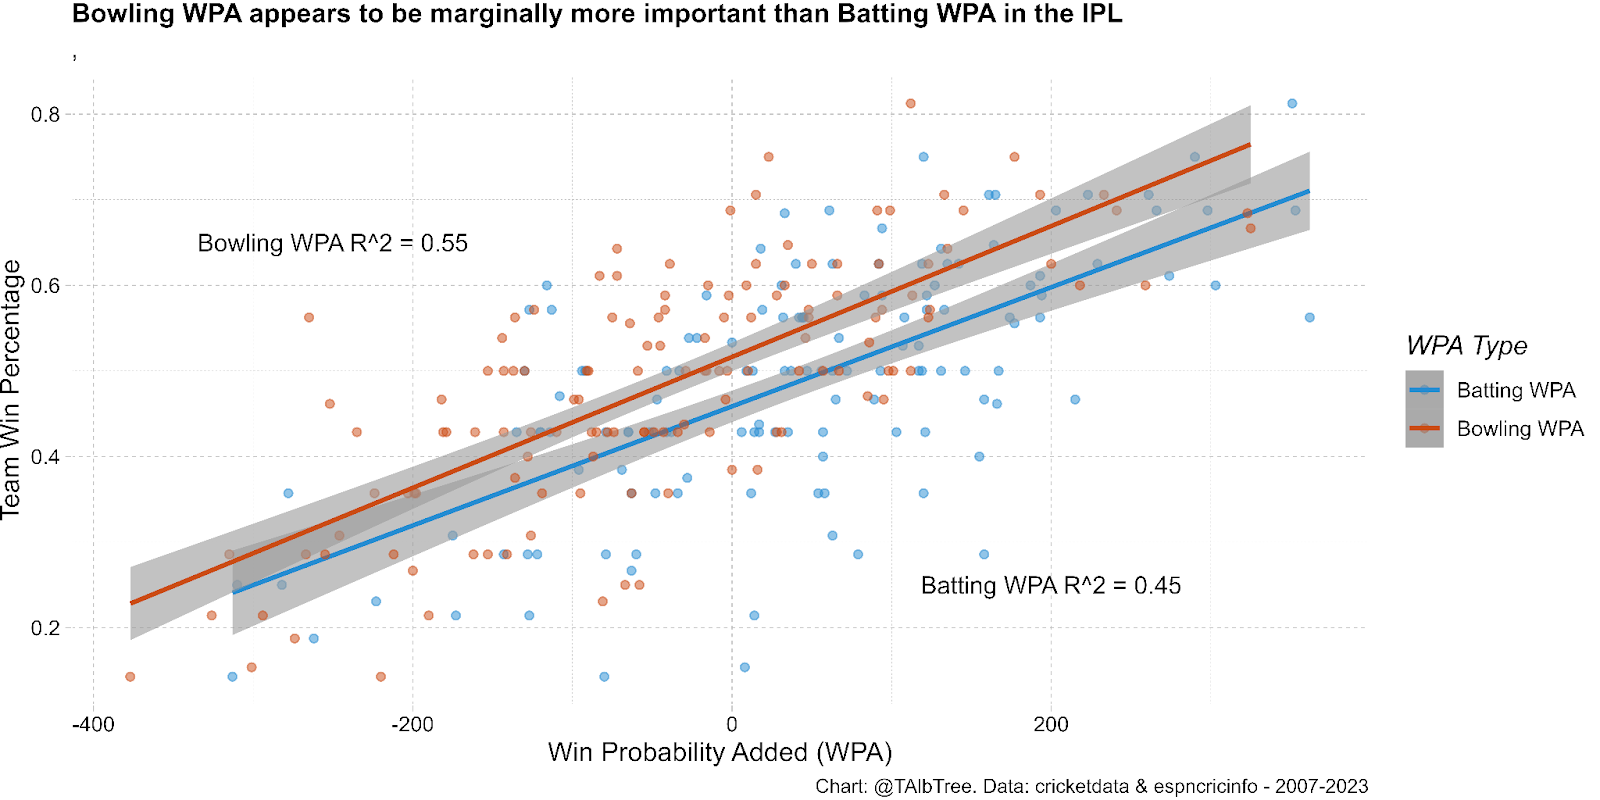
Using data from both the Indian Premier League, and the Major Twenty20 situations across the world – it appears that Bowling Win Probability Added is more highly positively correlated with Team Win Percentage than Batting Win Probability Added. Total Win Probability Added is highly positively correlated with Team Win Percentage in both the Indian Premier League (R^2: 0.82) and across the major Twenty20 competitions (R^2: 0.76). Therefore, we can use Win Probability Added as a fairly reasonable proxy for team success. 

The second part of our first question is: are high contract values correlated with higher Bowling performance?

Scatter and line plot of IPL salary amount of bowlers and all rounders compared to bowling win probability added
Scatter and line plot of IPL salary amount of bowlers and all rounders compared to bowling win probability added - split by position
Scatter and line plot of IPL salary amount of bowlers and all rounders compared to bowling win probability added per ball- split by position

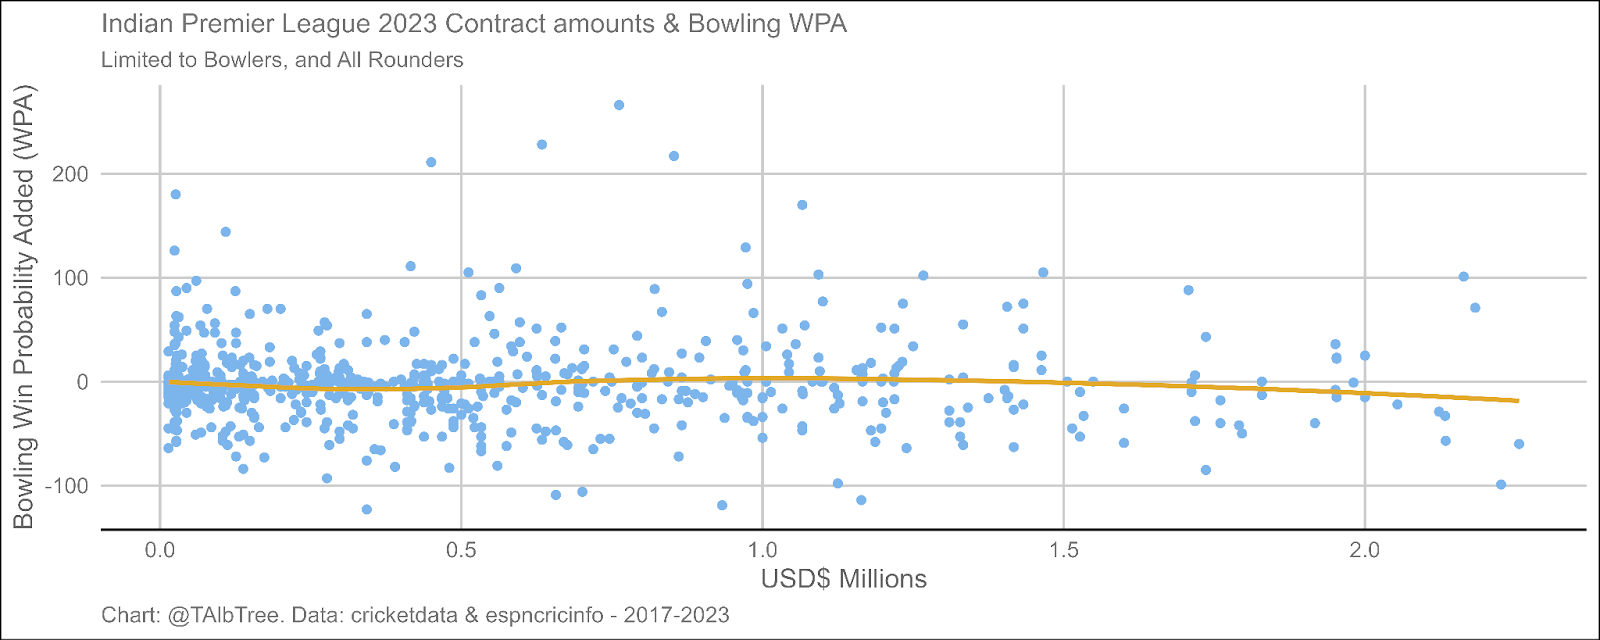
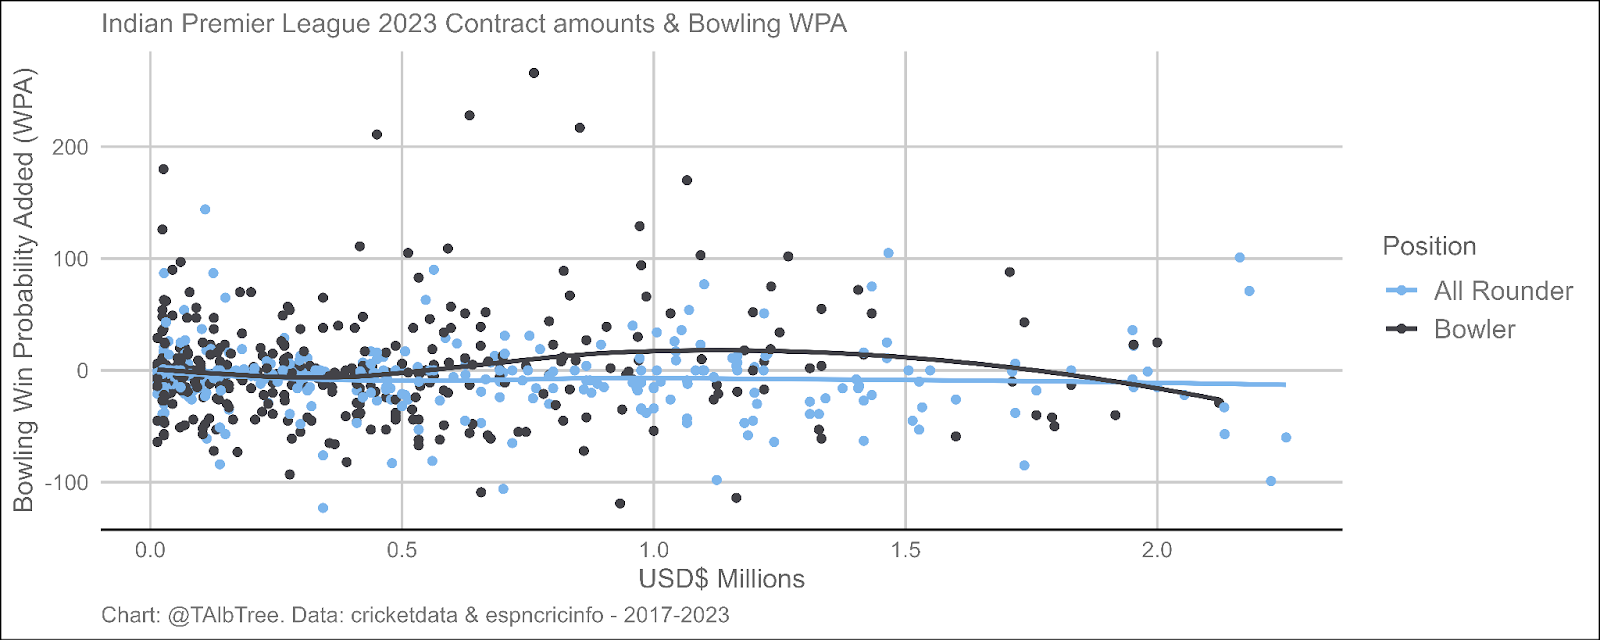
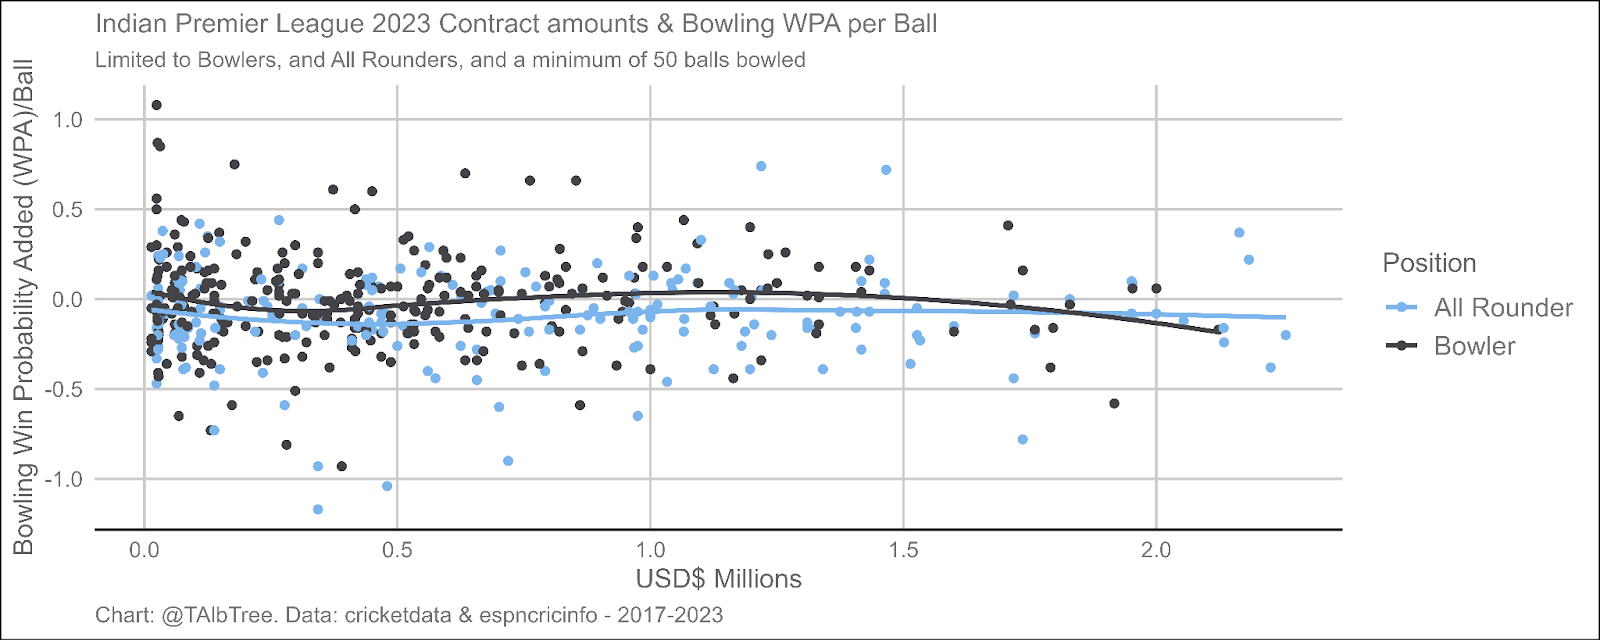
Using Win Probability Added as our primary metric it does not appear that more expensive contracts provider to Bowlers or All Rounders results in higher levels of Win Probability Added through their bowling efforts.This is reflected on both a Total Bowling WPA level, and on a Bowling WPA/Ball level.

So far we have: Bowling WPA is more correlated with Team Win percentage than Batting WPA, however by the same token, between 2017-2023, contract value was not correlated with Total Bowling WPA or Bowling WPA/Ball. Therefore, at this stage of the analysis, perhaps I’m content to go pretty cheap when paying bowlers? Given Bowler contracts are already substantially lower than other contracts, it appears the IPL decision makers agree with this strategy, however perhaps I’d propose they could be even more aggressive in their how little they target the bowlers? Ultimately though, you still need to pick the bowlers who are going to provide Win Probability – can we know that ahead of time? Is bowling WPA stable year to year?

4 scatter plots of bowling WPA in year N and Year N +1 across the four major Twenty20 competitions that have played more than one year (Big Bash, Indian Premier League, Super Smash League, T20 Blast). No correlation
4 scatter plots of bowling WPA per ball in year N and Year N +1 across the four major Twenty20 competitions that have played more than one year (Big Bash, Indian Premier League, Super Smash League, T20 Blast). No correlation

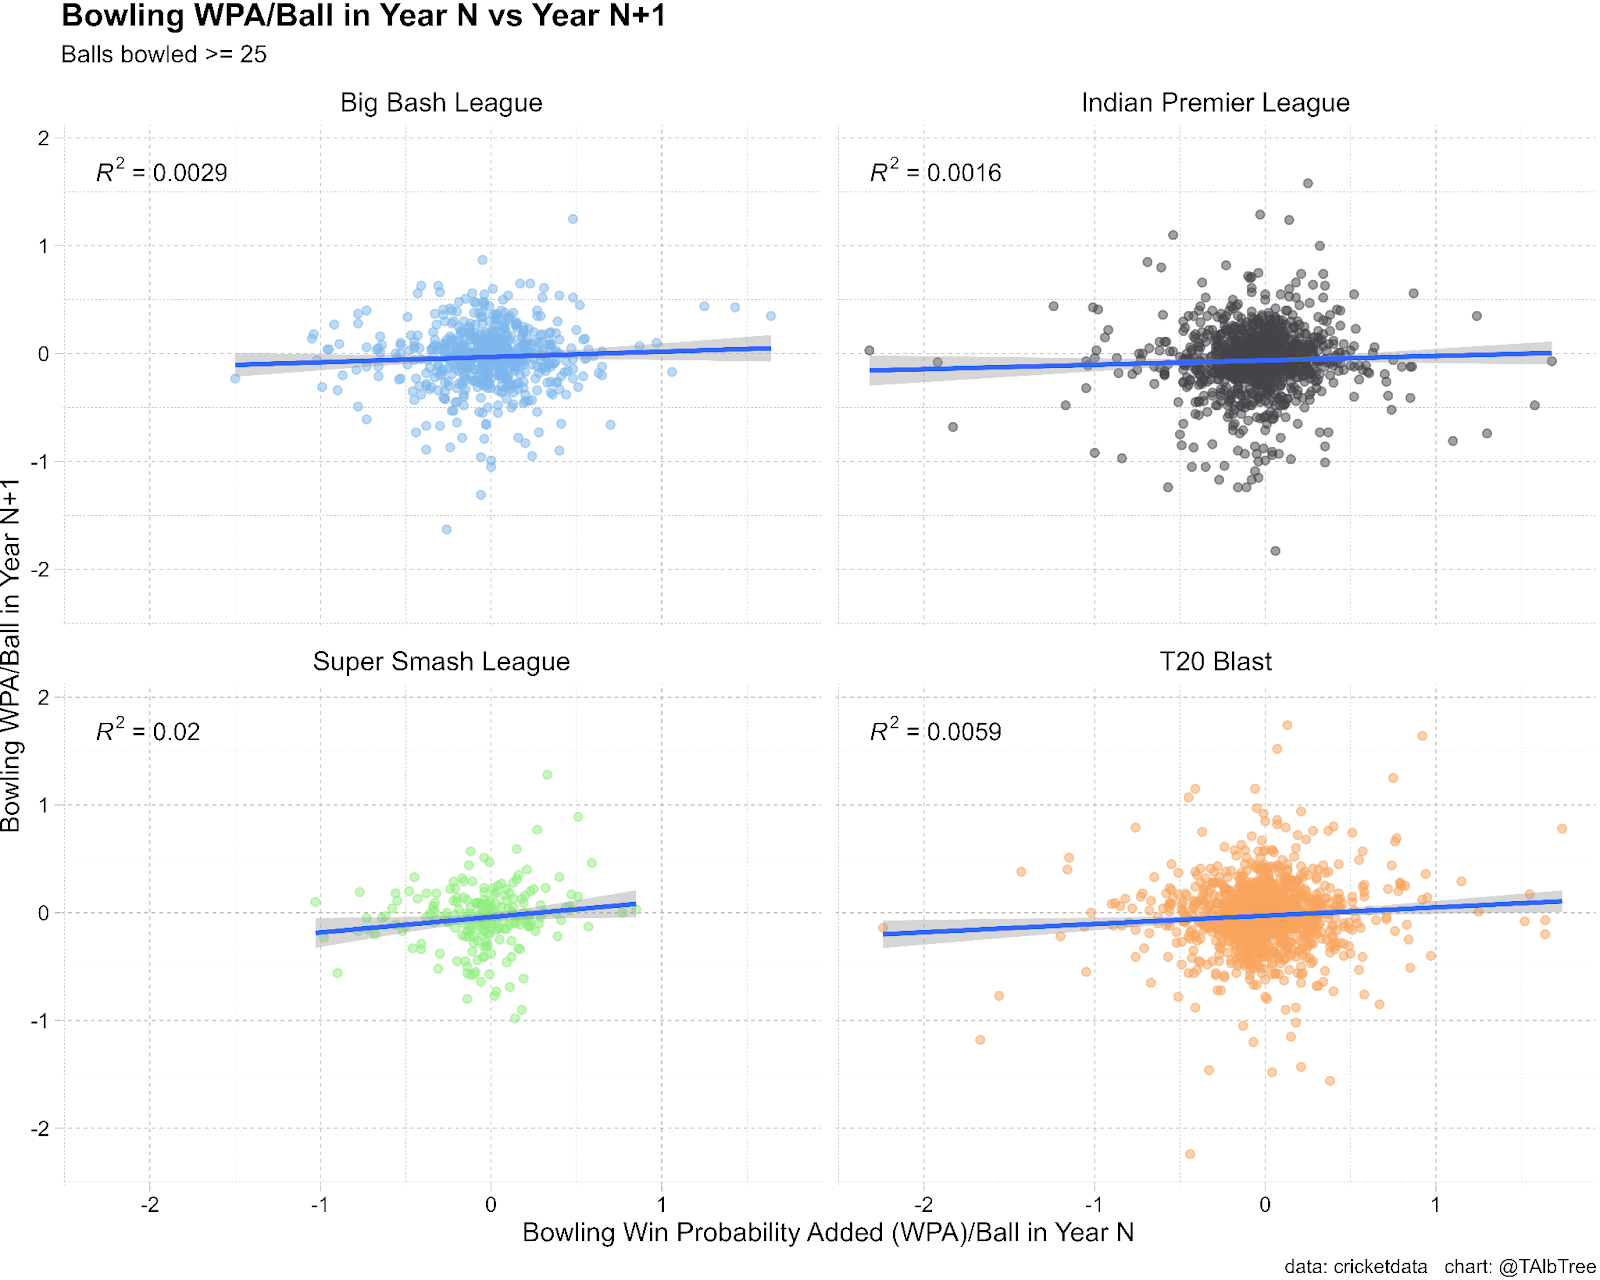
Based off these charts: No. It does not appear Bowling WPA is stable year to year, either in total, or on a per ball basis. Therefore, if I’m an IPL team, my current plan would be to go very cheap when it comes to Bowlers.

Over the past 7 years worth of data, which bowlers have been the highest paid in the IPL? How much Bowling WPA have they provided?

Table of the Top 10 most expensive bowler contracts in the IPL from 2017-2023

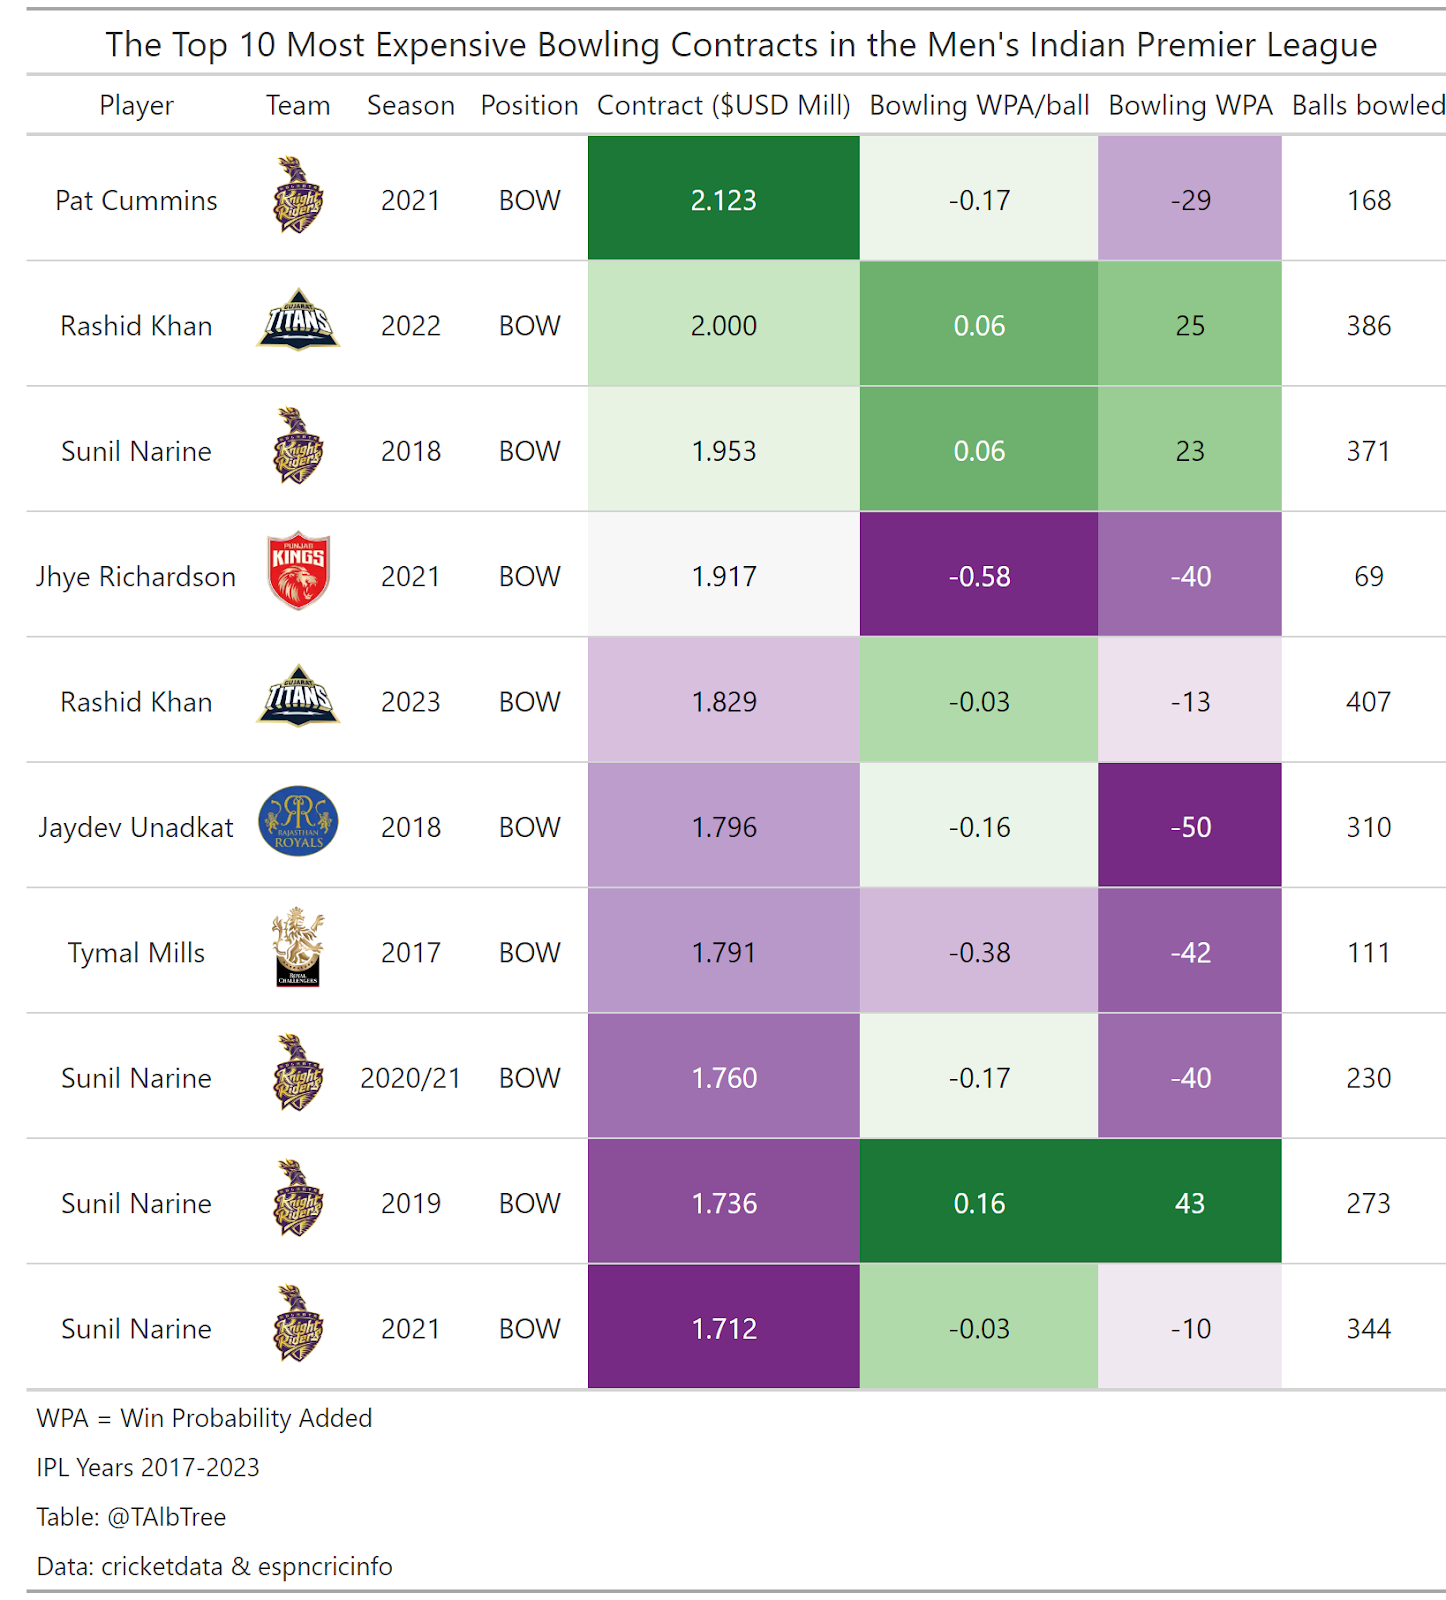
Out of the top 10 most expensive bowler contracts since 2017, only 3 of them have provided a positive Bowling WPA, with the highest coming from Sunil Narine in 2019 with a Bowling WPA of 43 points. 

What about for All Rounders? Keeping in mind that all rounders are also employed for their batting.

Top 10 most expensive all rounder contractsin the Indian Premier League from 2017-2023

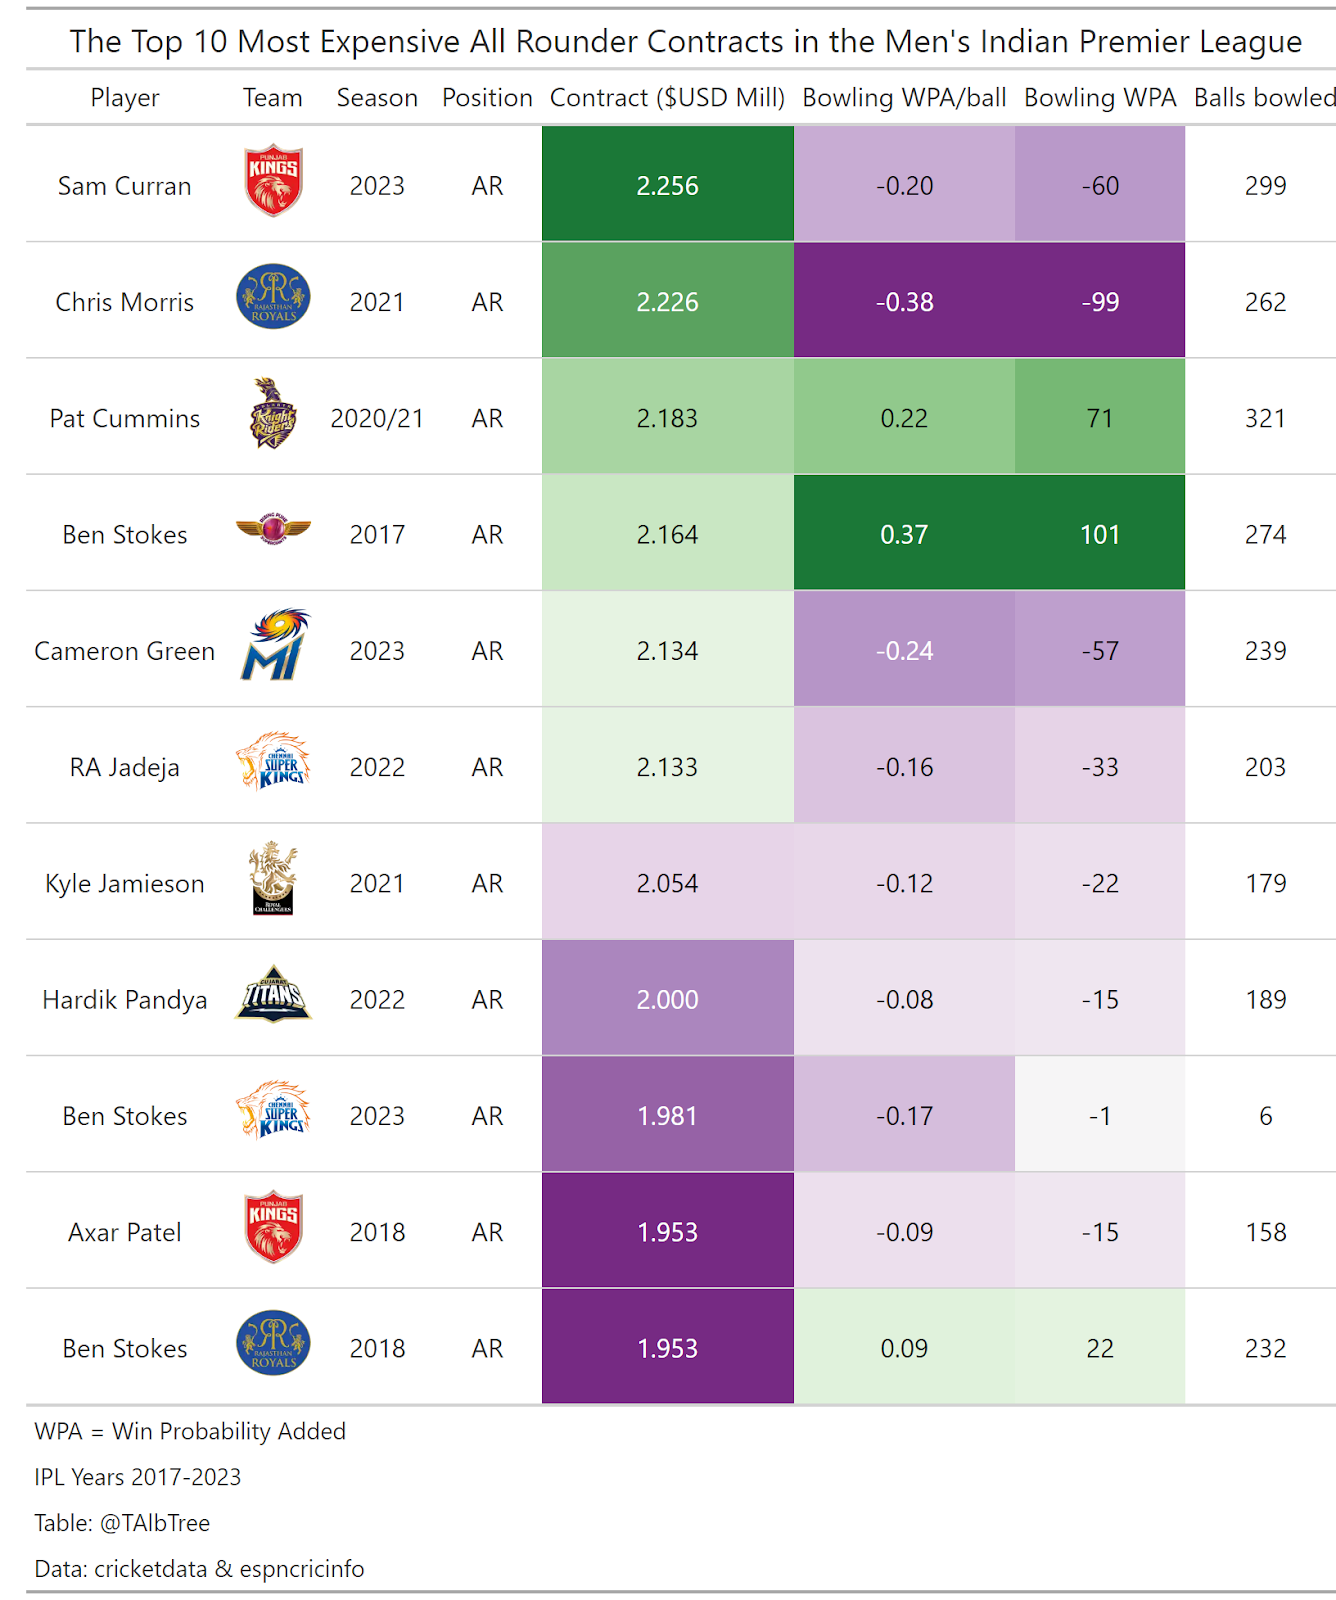
A wider range of bowling WPA in the All Rounders group. Ben Stokes in 2017 and Pat Cummings in 2021 provided significant benefit to their respective teams with their arms.

However, since 2017 which bowlers have provided the most total Bowling WPA in each season? And what have they been paid?

Table of the Top 10 most productive bowlers in terms of WPA in the IPL from 2017-2023

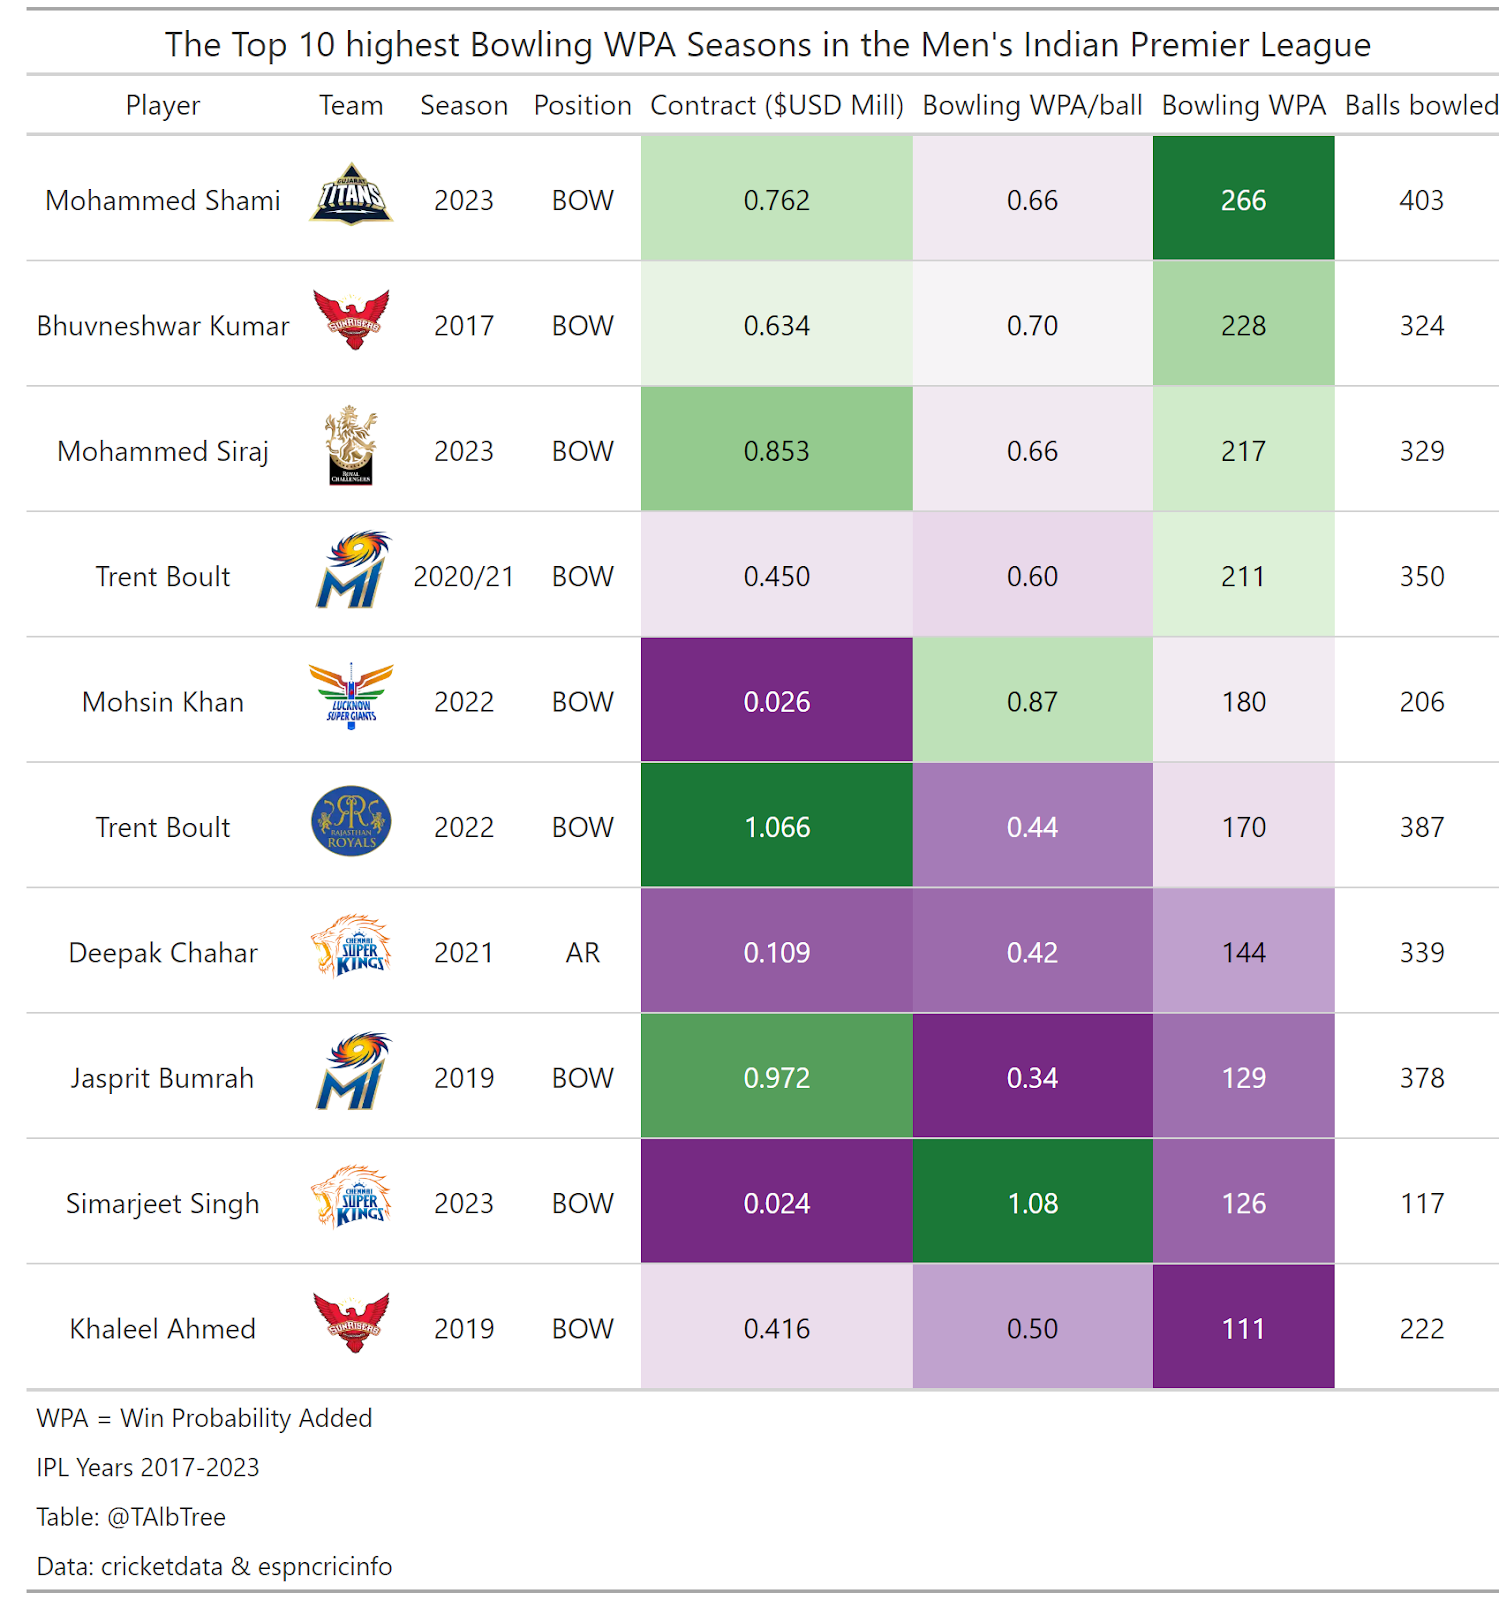
As you can see, the most productive bowlers since 2017 have not been the highest paid. Only one of them has been paid over USD$1 million, Trent Boult in 2022. The average contract of the Top 10 WPA Bowlers has been USD$531,200.

So teams shouldn’t be using high amounts of their cap on Bowlers, who should they be using their cap money on?

Scatter and line plot of IPL salary amount compared to batting win probability added - split by position
Scatter and line plot of IPL salary amount compared to batting win probability added per ball- split by position

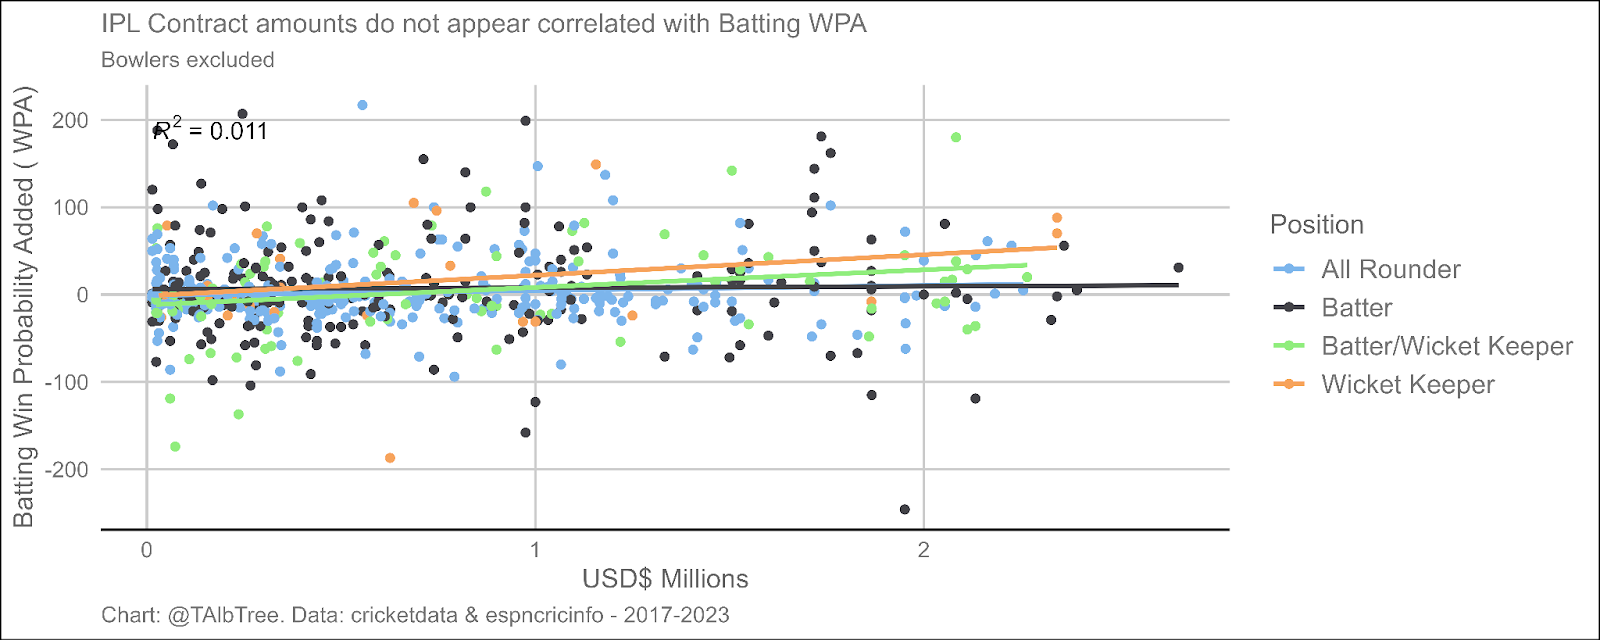
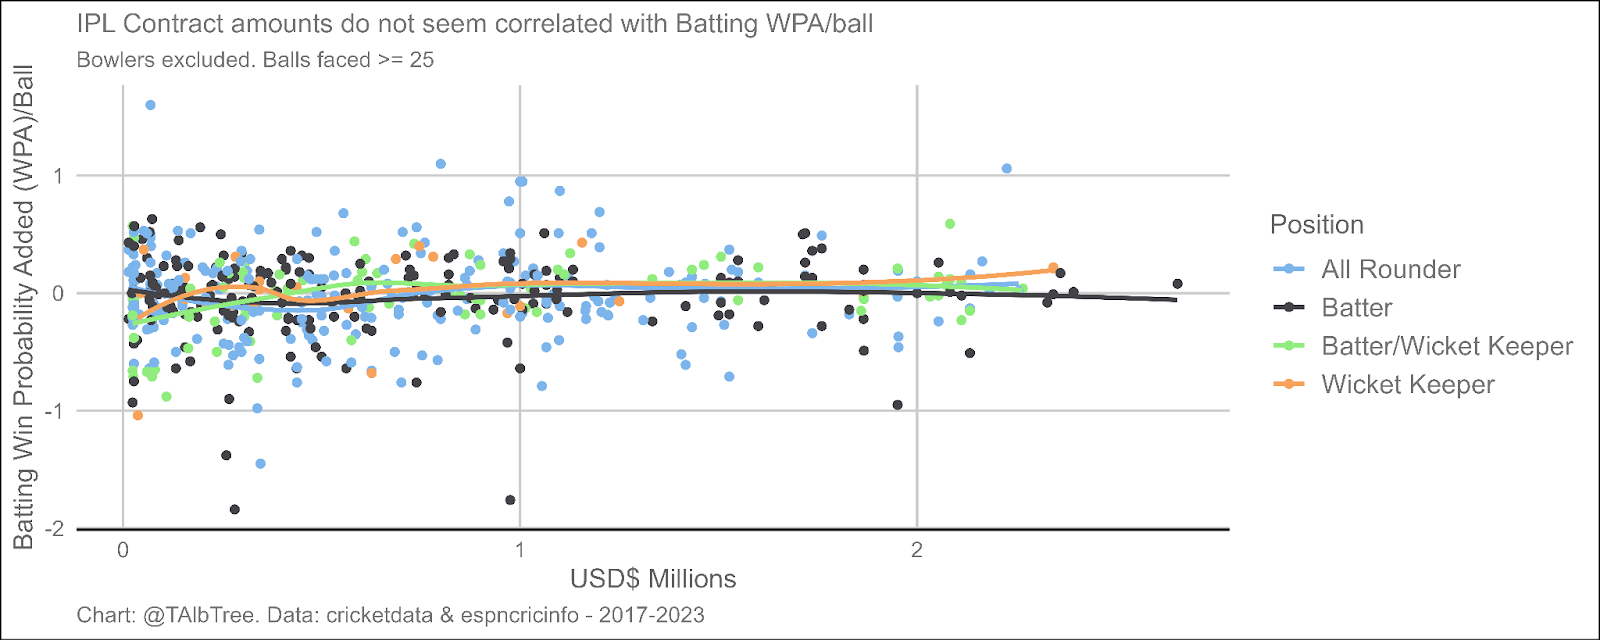
The above charts demonstrate that there does not appear to be any correlation between Contract amounts of those tasked with Batting, and their total Batting WPA, or their Batting WPA/Ball.

For the Batters I also reviewed whether there was any correlation between contract amounts of Expected Runs Added (XRA) whilst batting. 

Line plot demonstrated that expected runs increased towards the end of innings

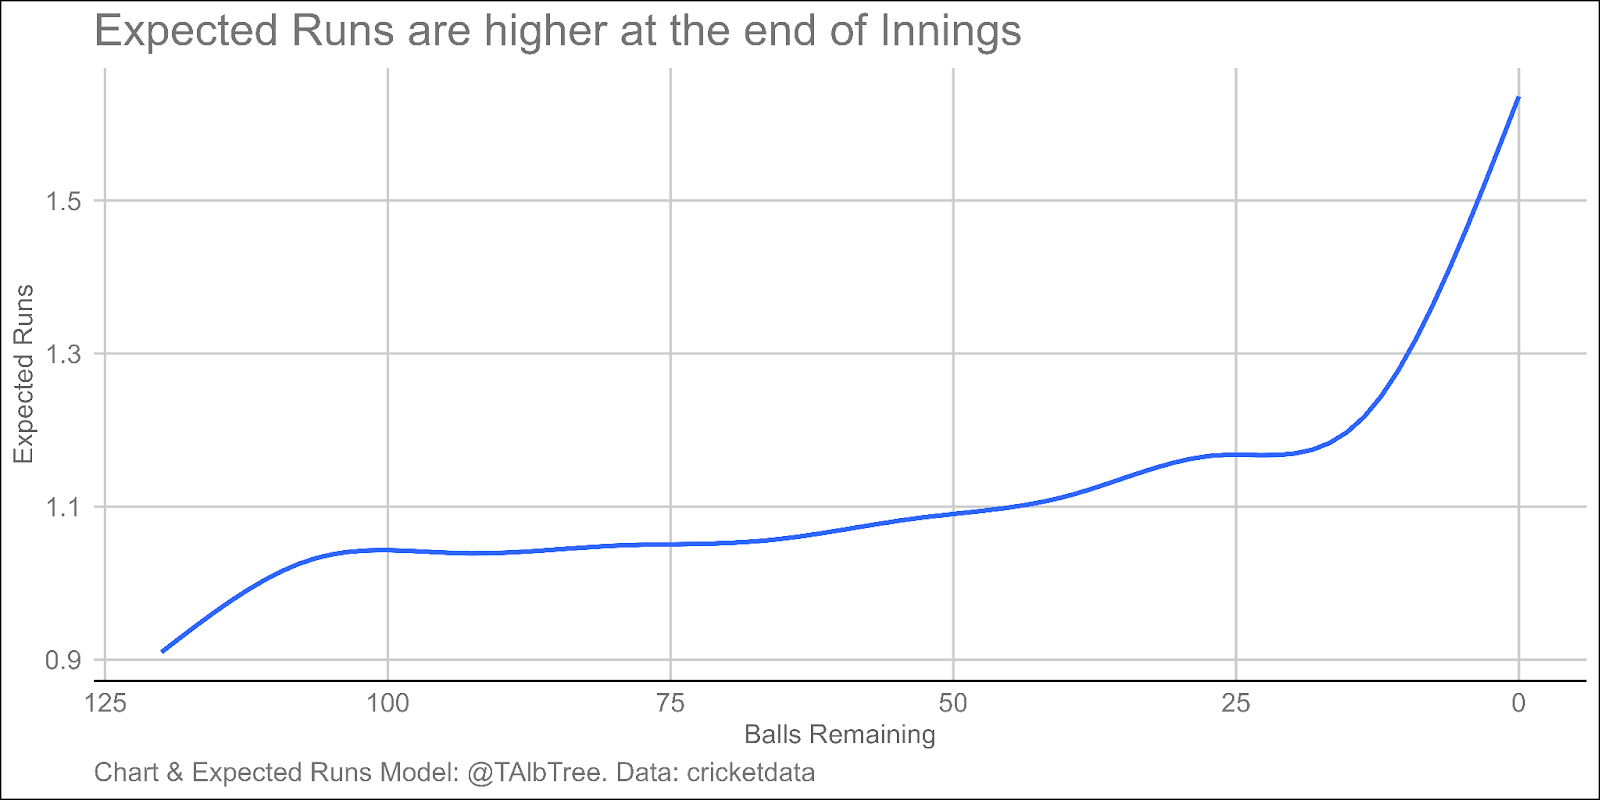
Expected Runs Added is a new term in this article. Similar to Win Probability, at each point in a Twenty20 match, based on historical data, each ball can be associated with a number of runs that should be expected to be contributed at that point in the game. The number of expected runs depends on the innings number, how many balls left in the innings, the amount of runs already scored, the amount of wickets already lost, and if in the second innings, how many runs needed to win. Expected runs added is the amount of runs scored on a given ball, minus the expected runs of that ball given that situation. The mean expected runs on a ball are 1.09 runs. I prefer to only use XRA for Batters and not for Bowlers, as on an average play a bowler can only contribute a bowling expected runs added anywhere between 0 and 1.09, this is a small range. Batters however could contribute up to 4.81 Expected Runs Added on an average play. Therefore, it’s not fair to compare Batting and Bowling XRA.

Scatter and line plot of IPL salary amount compared to batting win expected runs added - split by position. R squared - 0.12
Scatter and line plot of IPL salary amount compared to batting win expected runs added per ball- split by position.No correlation

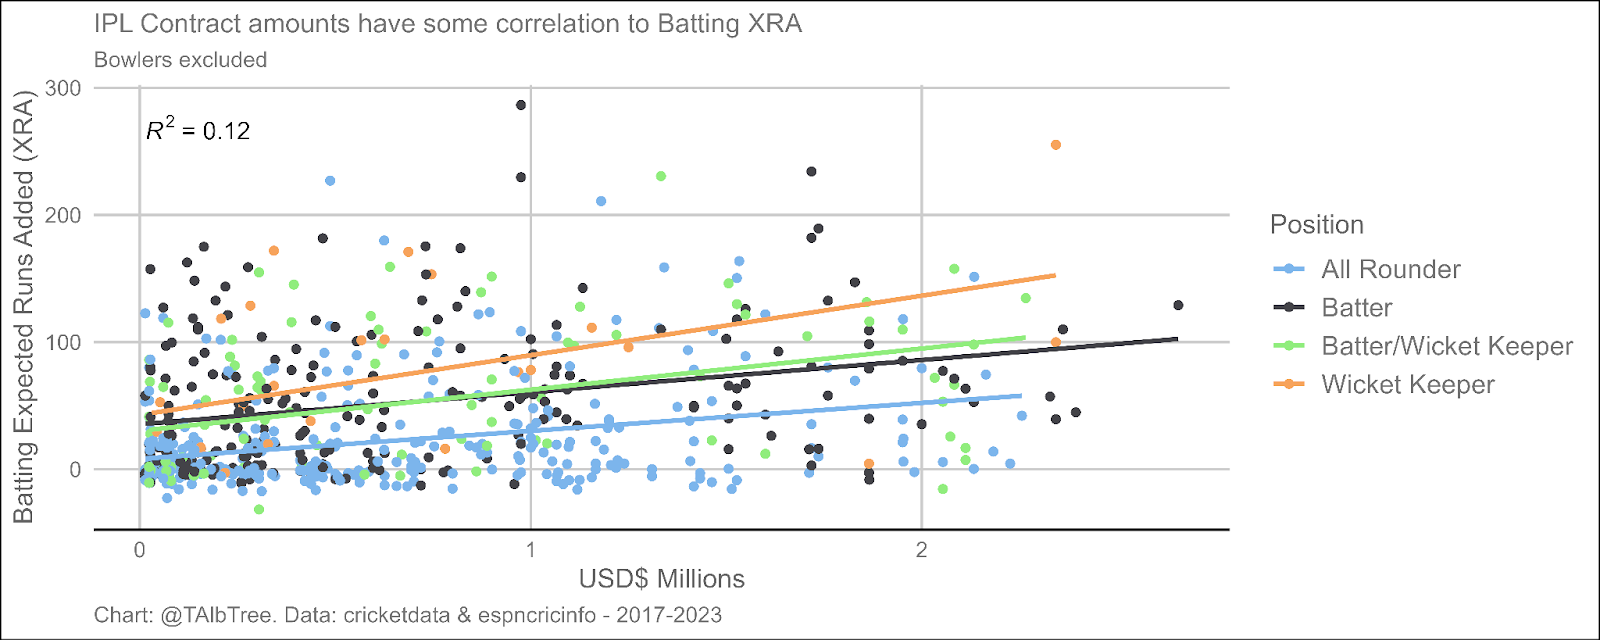
The first chart indicates that there has been some correlation between IPL Contract Amounts and Total Batting XRA. The second chart however indicates that on a per ball basis, there doesn’t appear to be any correlation.

Scatter and line plot of IPL salary amount compared to balls faced whilst batting - split by position. R squared - 0.21

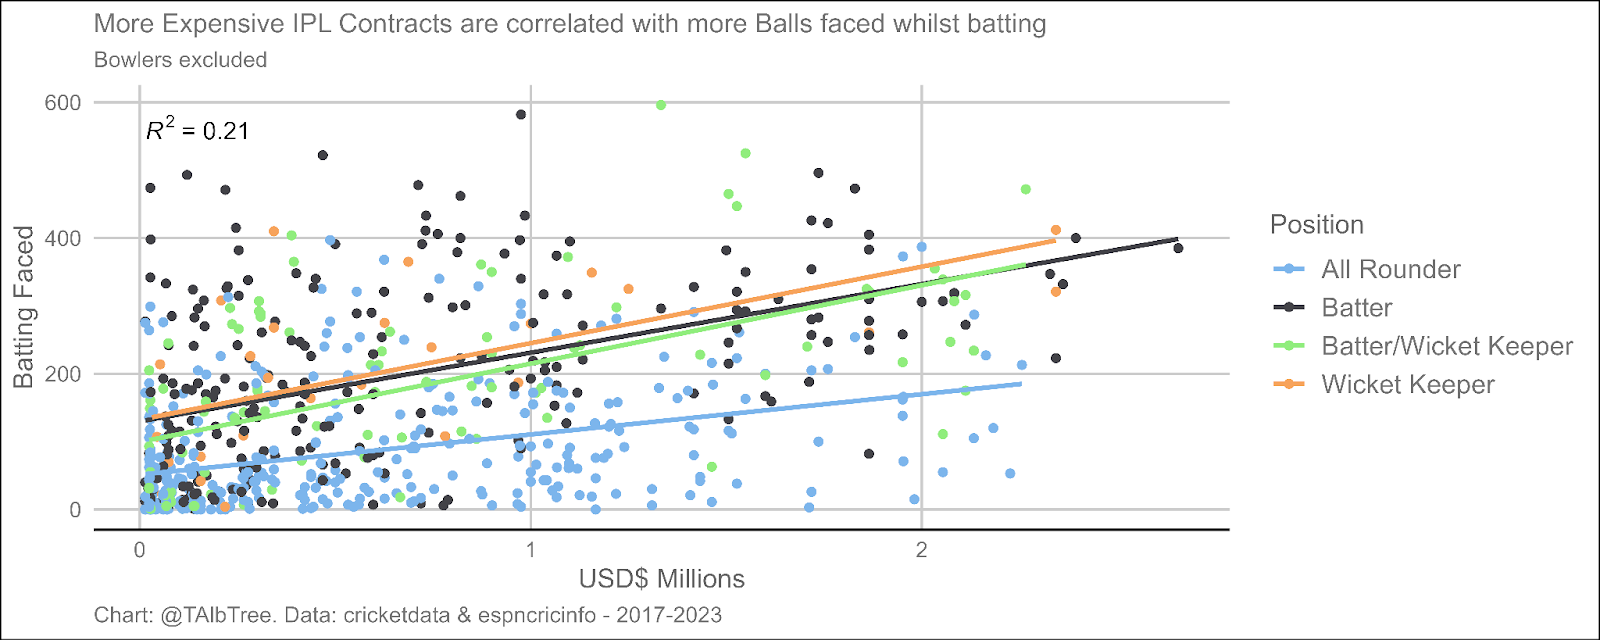
Interestingly, there is correlation between IPL Contract amount and the amount of balls they’ve faced whilst batting. This helps explain why there is some correlation between Contract amount of Batting XRA, however that there isn’t between Contract amount and Batting XRA/Ball. Is there a correlation between Contract amount and and amount of balls faced because those that are paid more are more likely to bat earlier in the order? Or do they keep their wicket for longer? Even if they did keep their wicket longer than those on cheaper contracts, given there doesn’t appear to be any correlation between Contract amount and Batting WPA, Batting WPA/Ball or Batting XRA/Ball, are perhaps these expensive Batters merely taking up space at the top of the batting order without actually contributing meaningfully to their team’s success?

This phenomena seems similar to how it seems like NFL (American Football) teams seem to remain committed to playing their highly paid running backs, even if their cheaper, backup running back appears to be more efficient (see Ezekiel Elliot & Tony Pollard the last few years), possibly because of sunk cost fallacy with the contract they provided them, I wonder if IPL teams should be challenged to play their best Batters earlier in the order even if they’re cheaper, and less “sexy”. This comes with some caveats though – Win Probability is generally more likely to have larger swings later on in an innings which could explain why some of the cheaper batters, if they are truly batting further down the order, may have more opportunity to accrue WPA than those batting earlier in the order. In saying that, the opposite is also true – those batting later in the order could be prone to losing more WPA in high leverage situations.

As I did for bowlers, is Batting WPA or Batting XRA stable year on year? As this information is crucial to know from a team building perspective.

4 scatter plots of batting WPA in year N and Year N +1 across the four major Twenty20 competitions that have played more than one year (Big Bash, Indian Premier League, Super Smash League, T20 Blast). No correlation
4 scatter plots of batting WPA per ball in year N and Year N +1 across the four major Twenty20 competitions that have played more than one year (Big Bash, Indian Premier League, Super Smash League, T20 Blast). No correlation

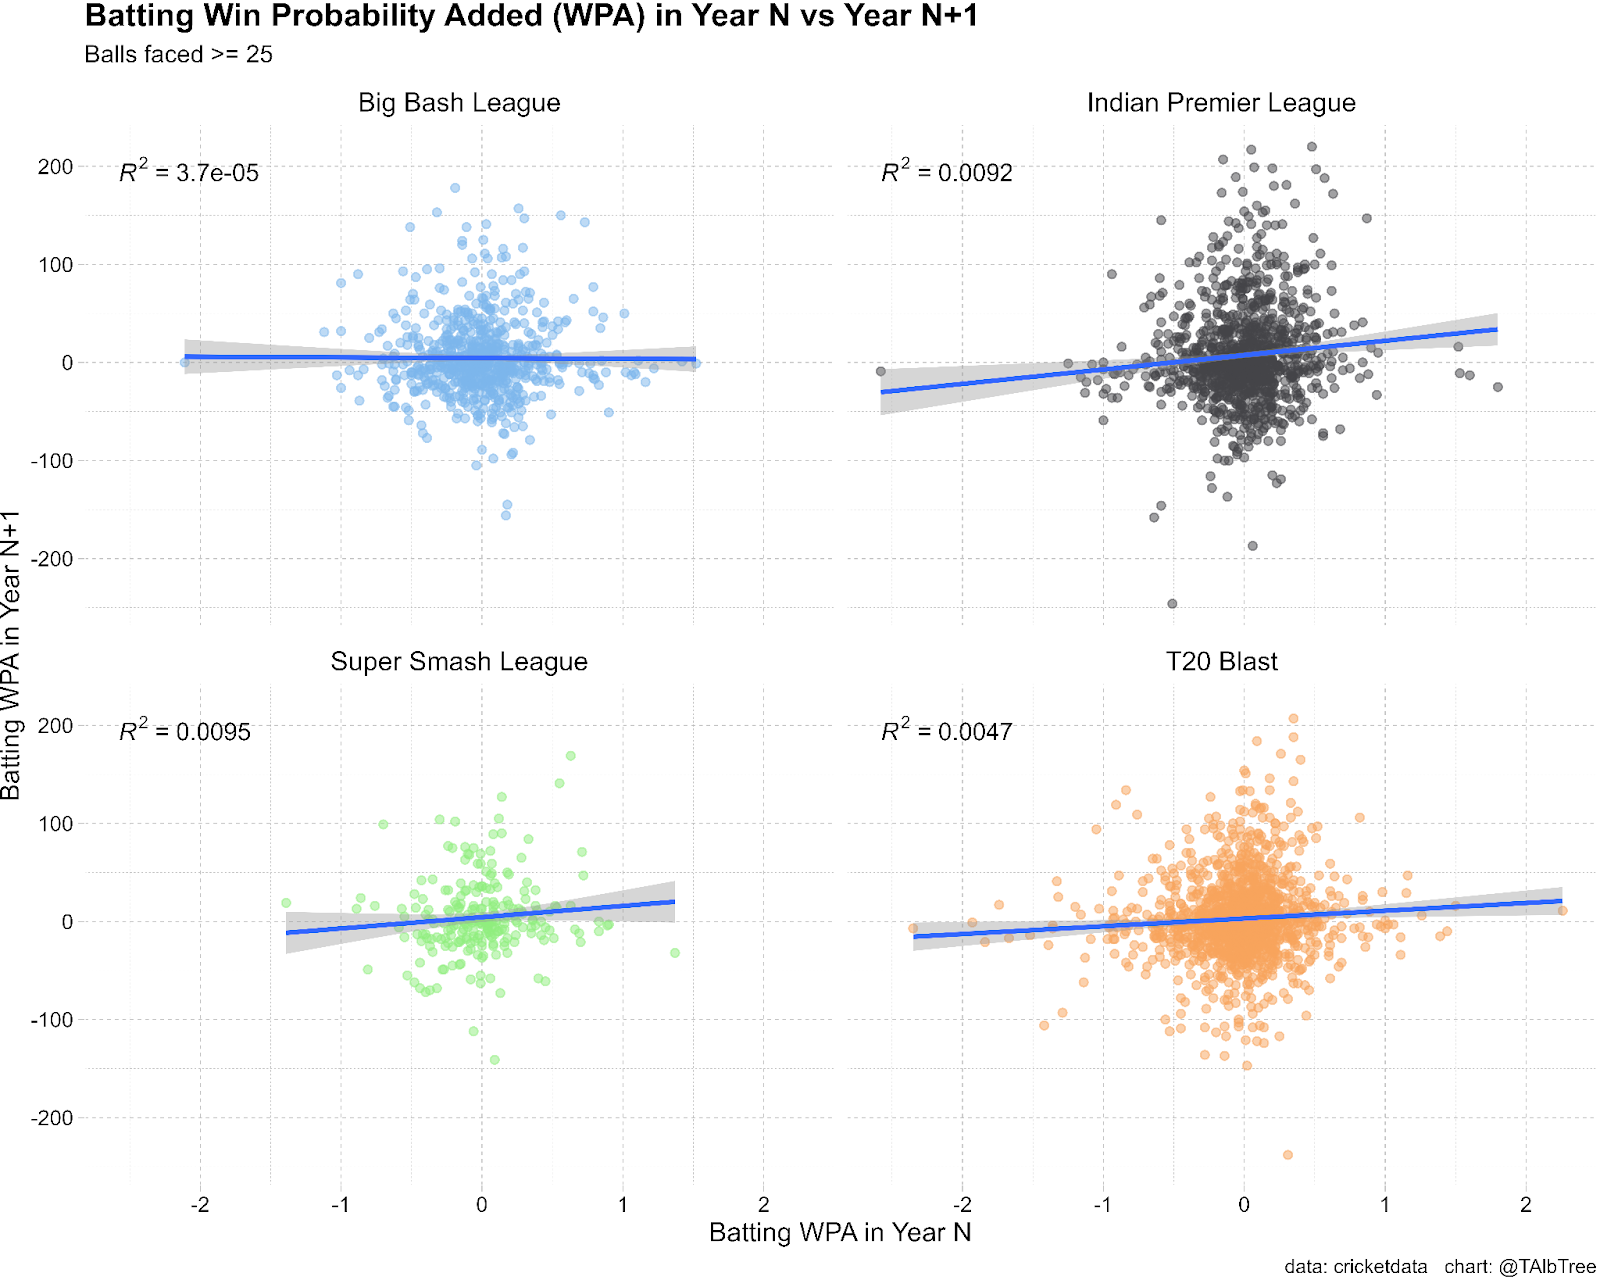
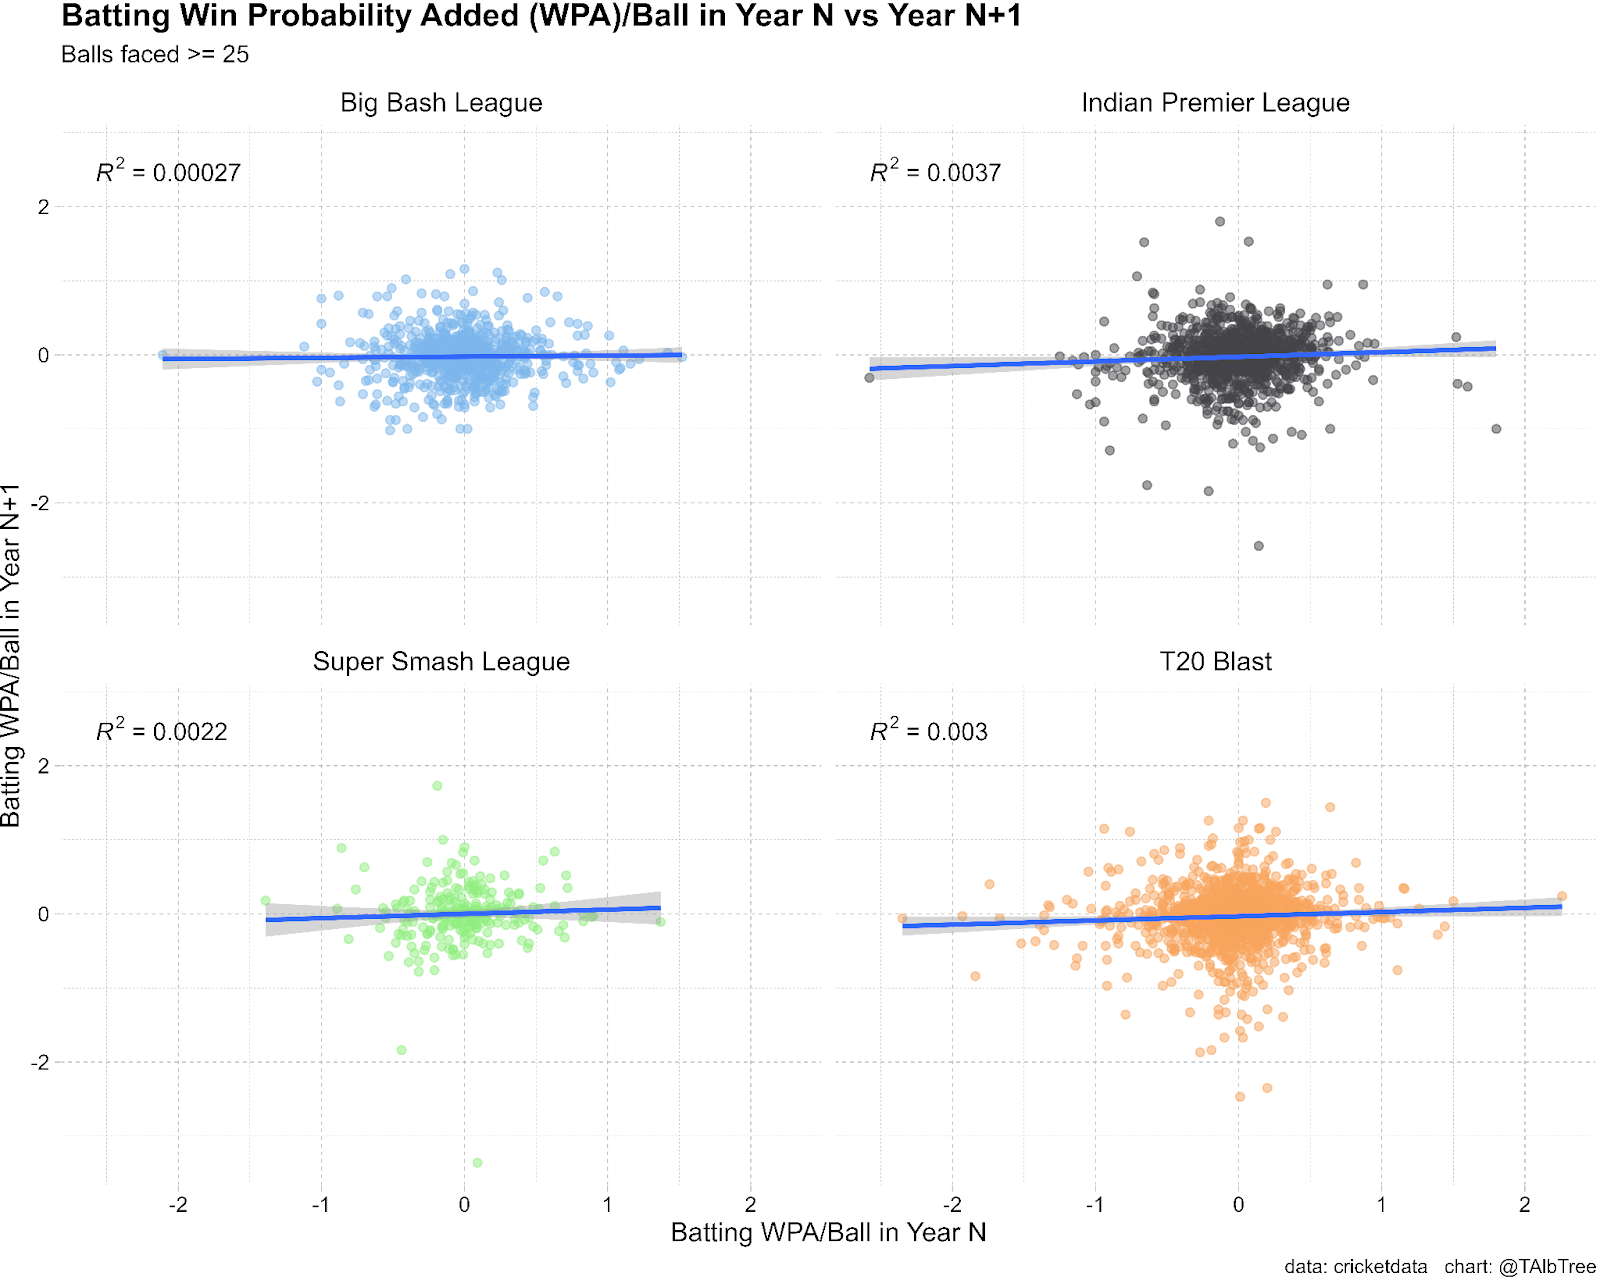
Batting WPA, total, and on a per ball basis, appears to be unstable year to year.

4 scatter plots of batting expected runs added in year N and Year N +1 across the four major Twenty20 competitions that have played more than one year (Big Bash, Indian Premier League, Super Smash League, T20 Blast). R squared in IPL 0.094, T20 Blast 0.11, BBL 0.05, Super Smash League 0.083
4 scatter plots of batting expected runs added per ball in year N and Year N +1 across the four major Twenty20 competitions that have played more than one year (Big Bash, Indian Premier League, Super Smash League, T20 Blast). R squared in IPL 0.11, T20 Blast 0.1, BBL 0.047, Super Smash League 0.073

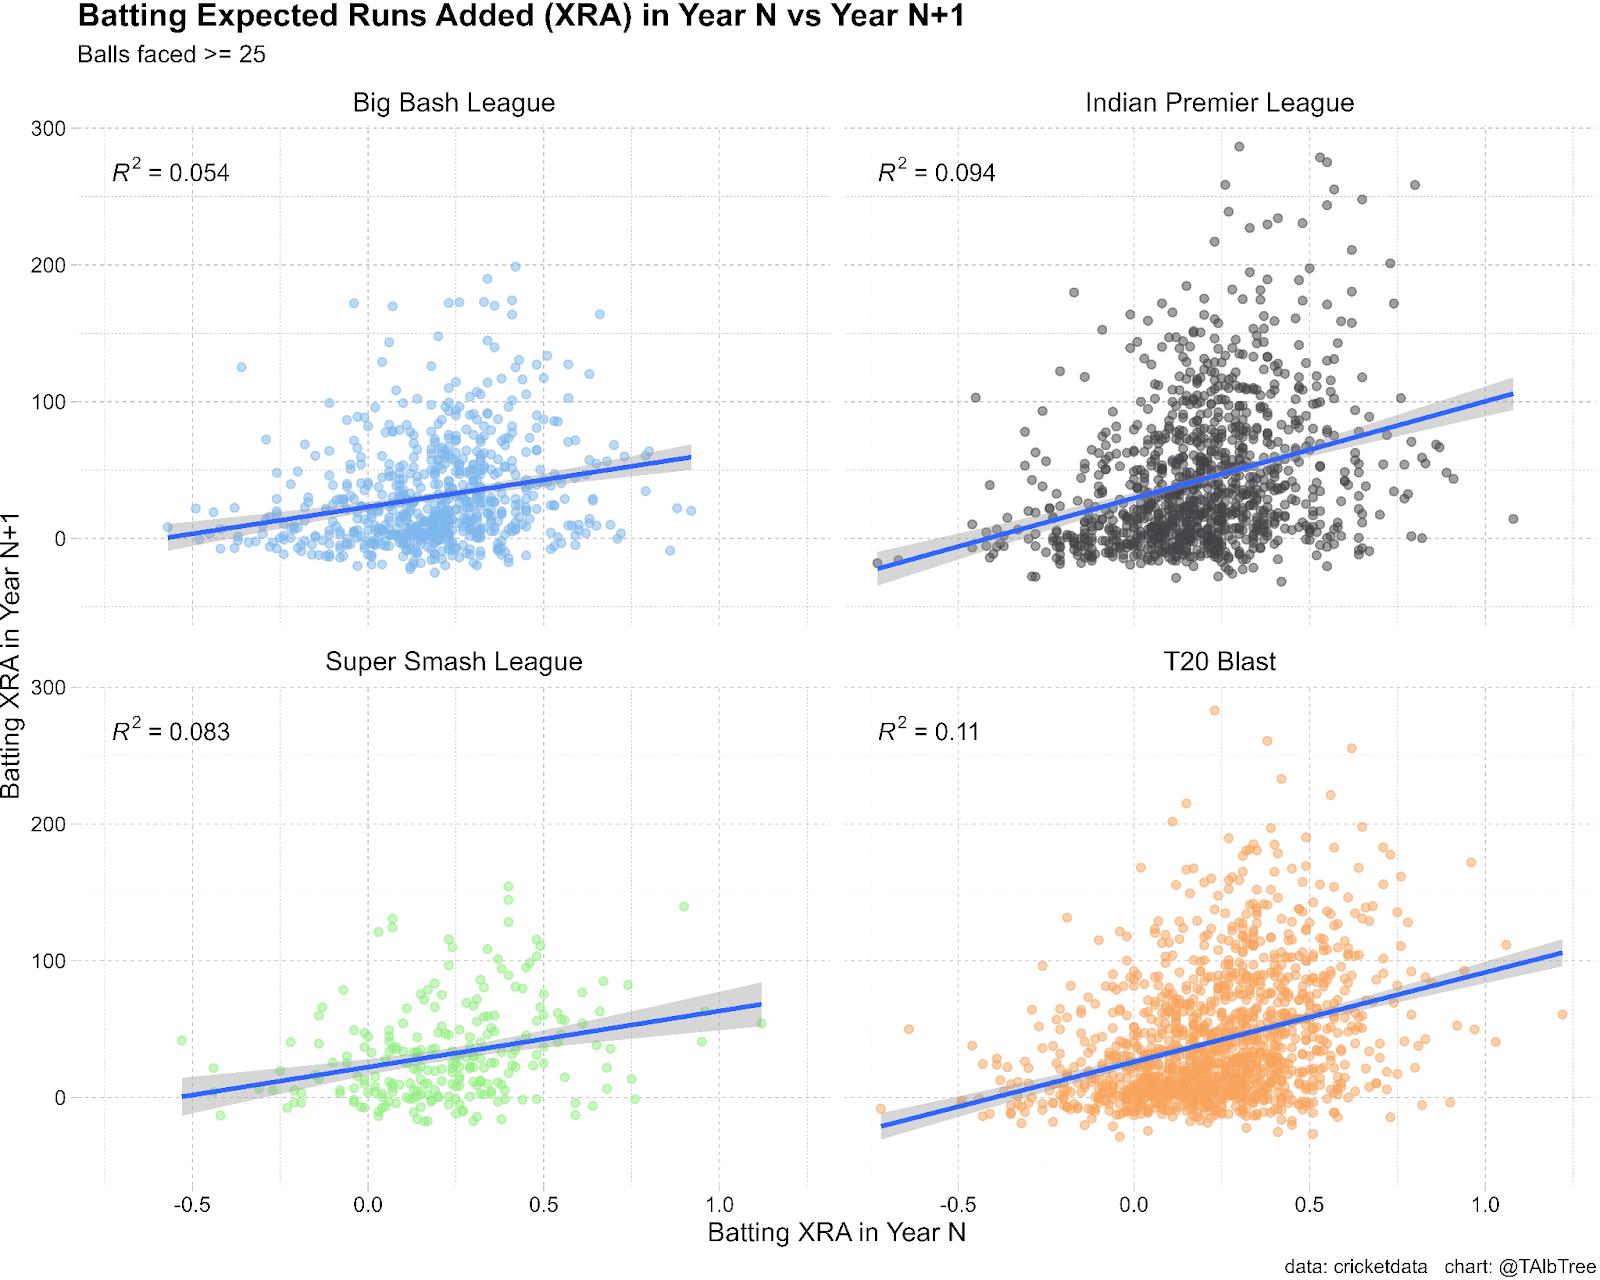
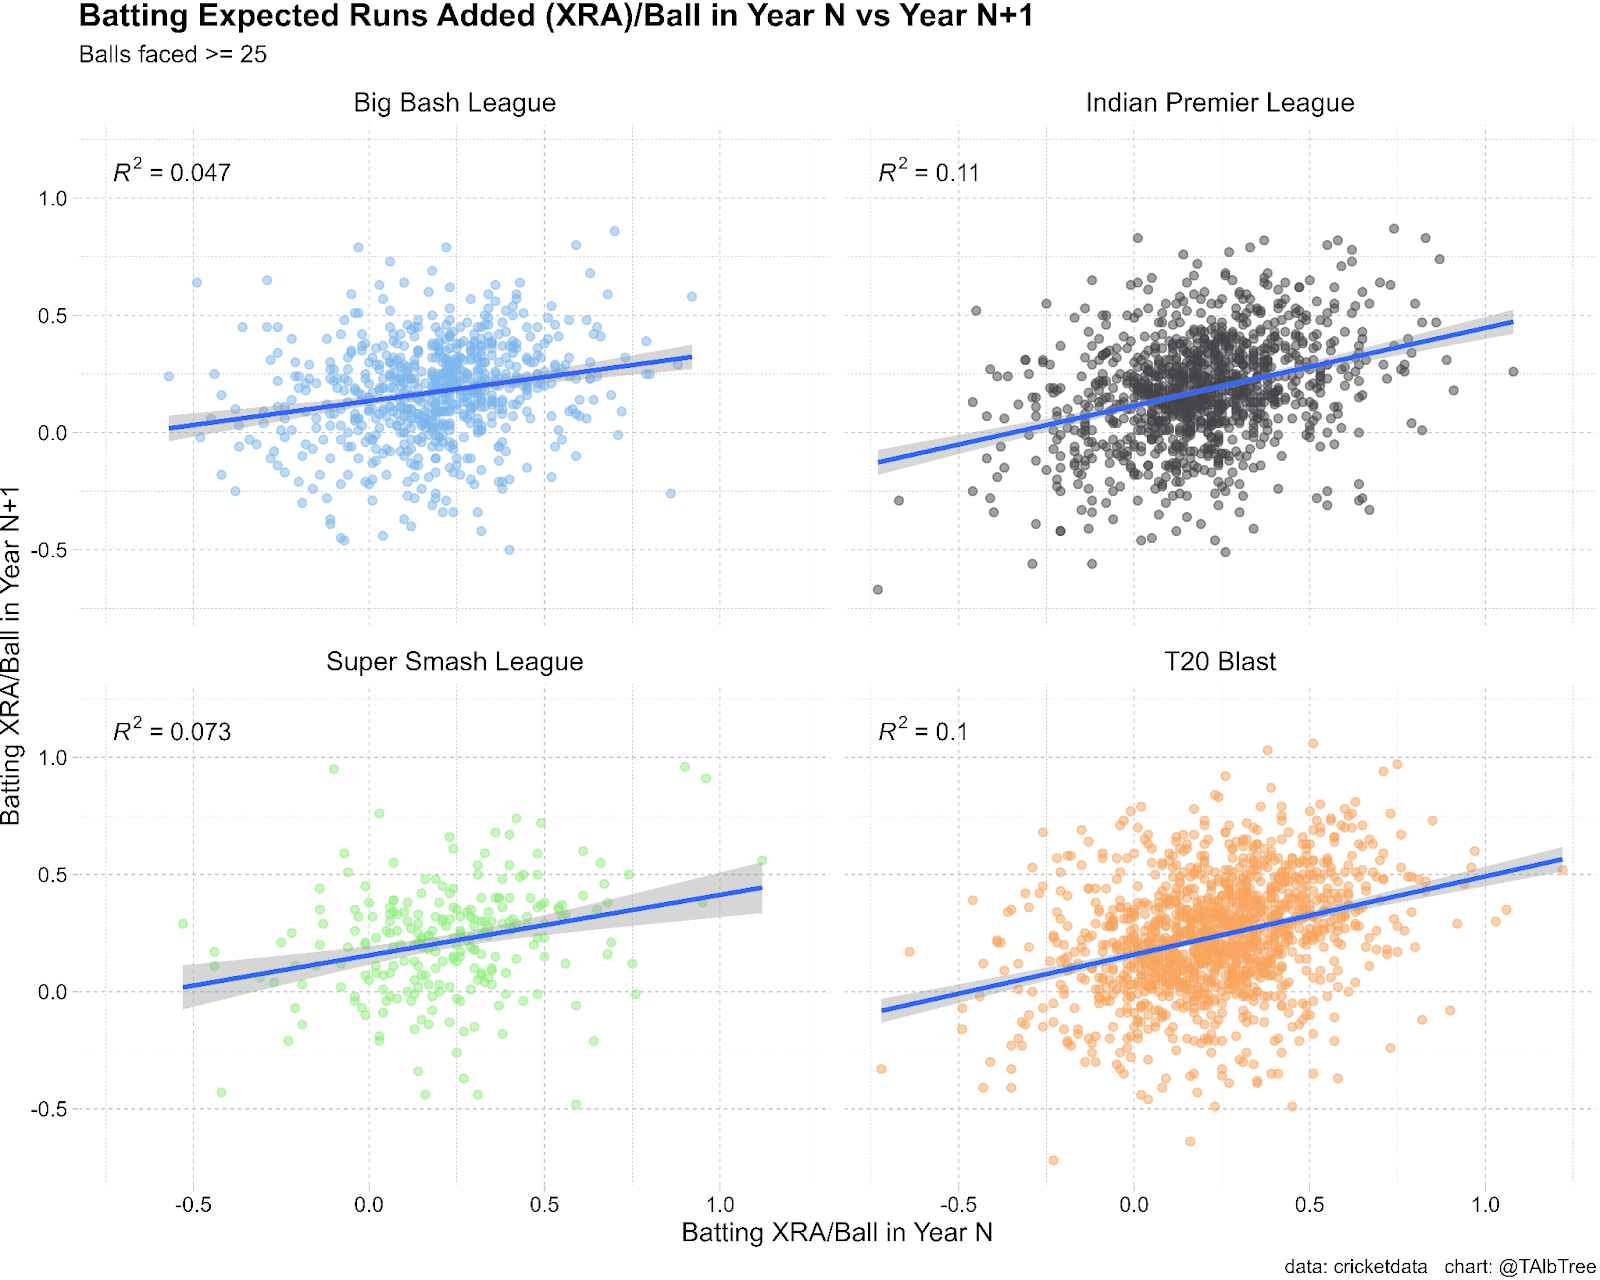
Interestingly, in the IPL, batting XRA appears to have much more stability (although, remains low) from year to year than WPA, and this is maintained on a per ball basis too.

4 scatter plots of atting balls faced in year N and Year N +1 across the four major Twenty20 competitions that have played more than one year (Big Bash, Indian Premier League, Super Smash League, T20 Blast). R squared in IPL 0.55, T20 Blast 0.39, BBL 0.4, Super Smash League 0.41

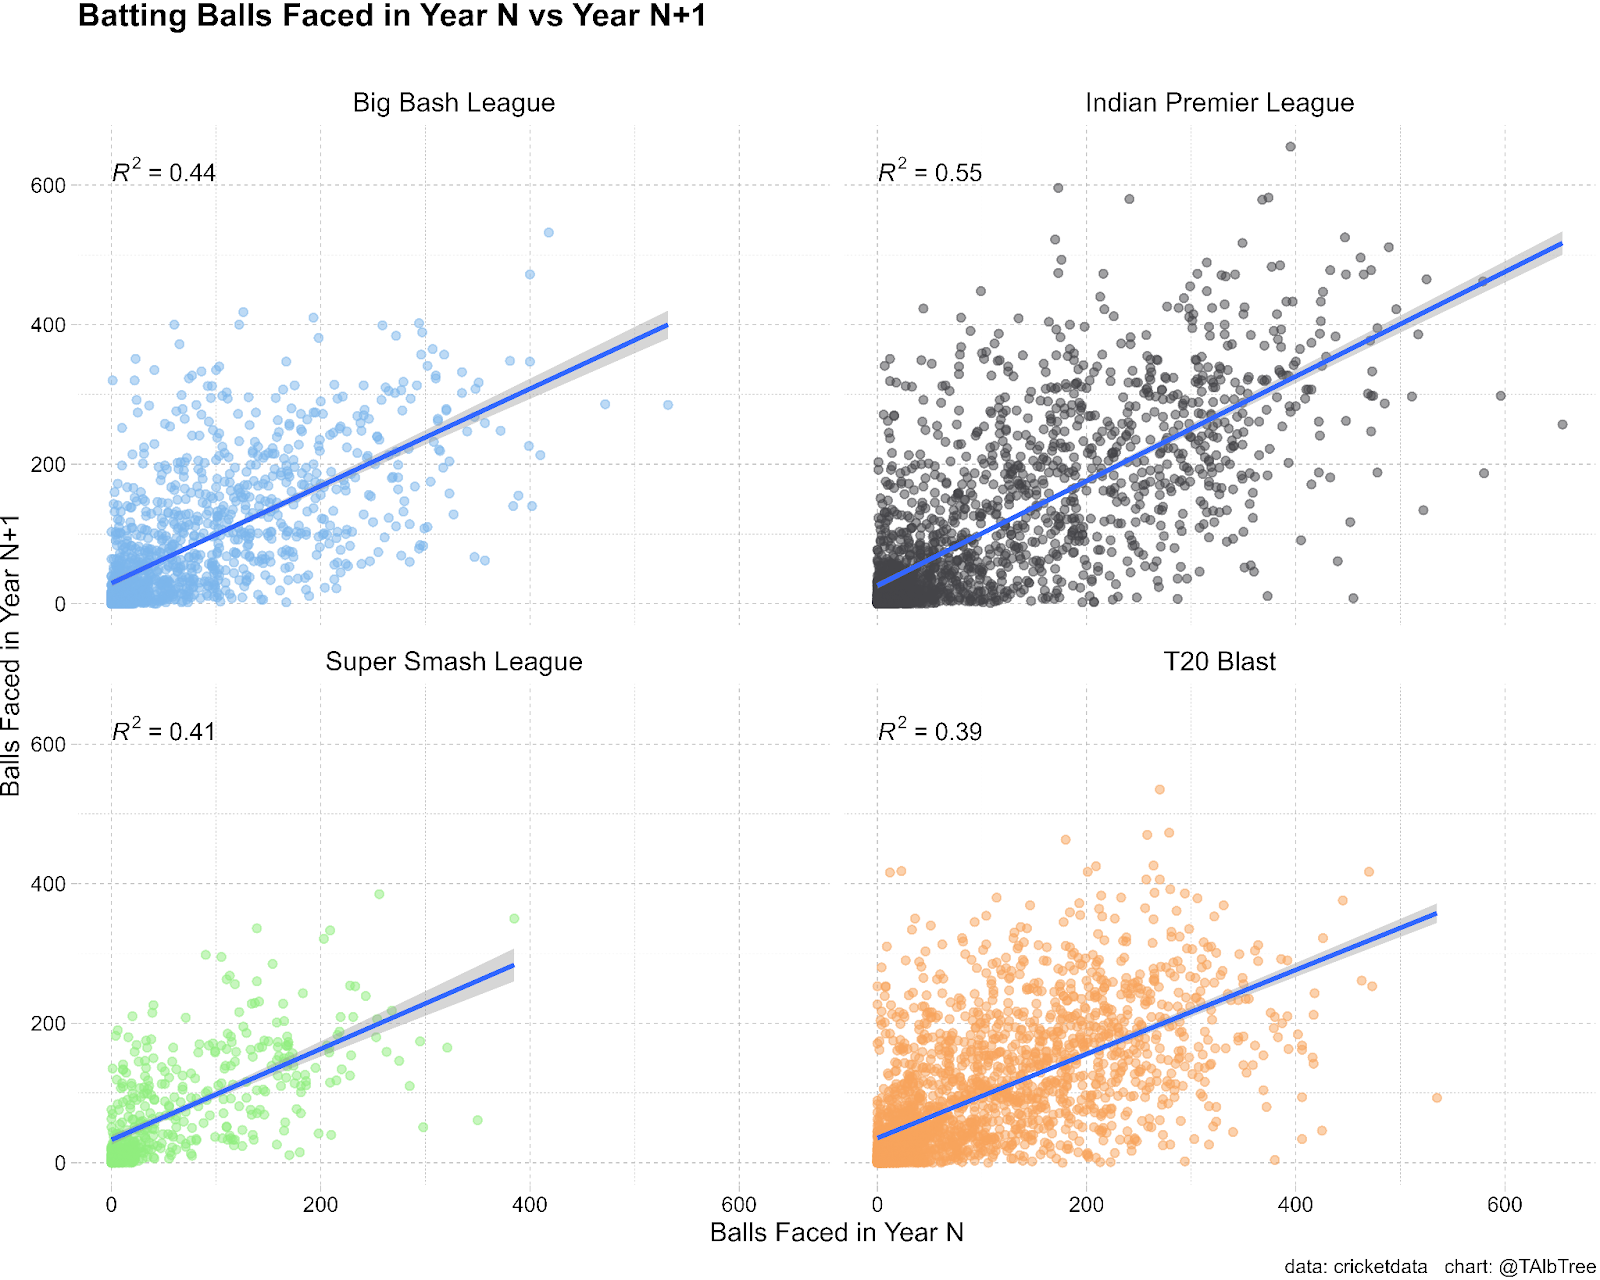
It’s understandable that total batting XRA has some stability year on year as number of balls faced is actually very stable year on year across the four major Twenty20 competitions.

Table of the Top 10 most expensive batters in the IPL from 2017-2023

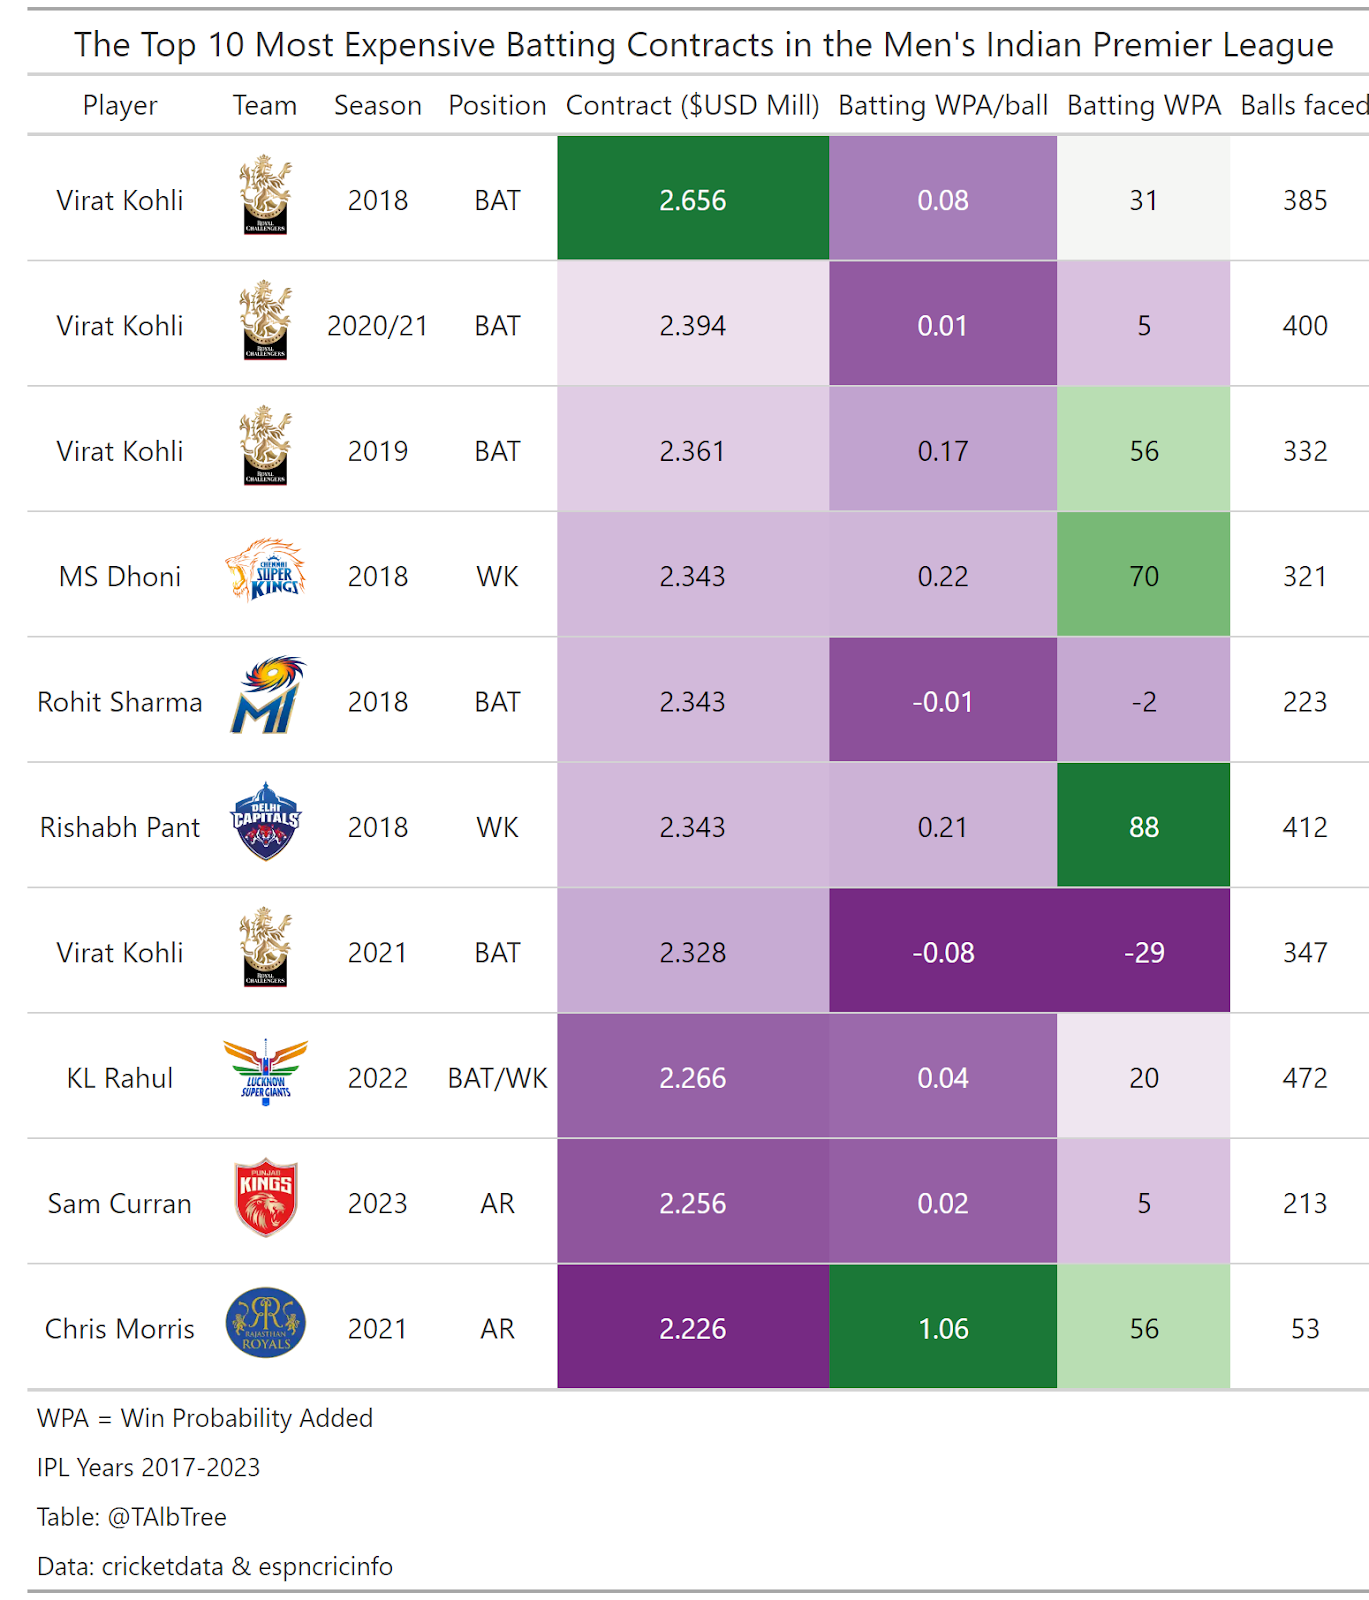
Virat Kohli has 4 of the 10 most expensive Batting Contracts since 2017. Although he has primarily been a net positive for his teams from a Batting perspective, on a per ball basis he’s been middling.

Table of the Top 10 most productive batters in terms of batting WPA in the IPL from 2017-2023

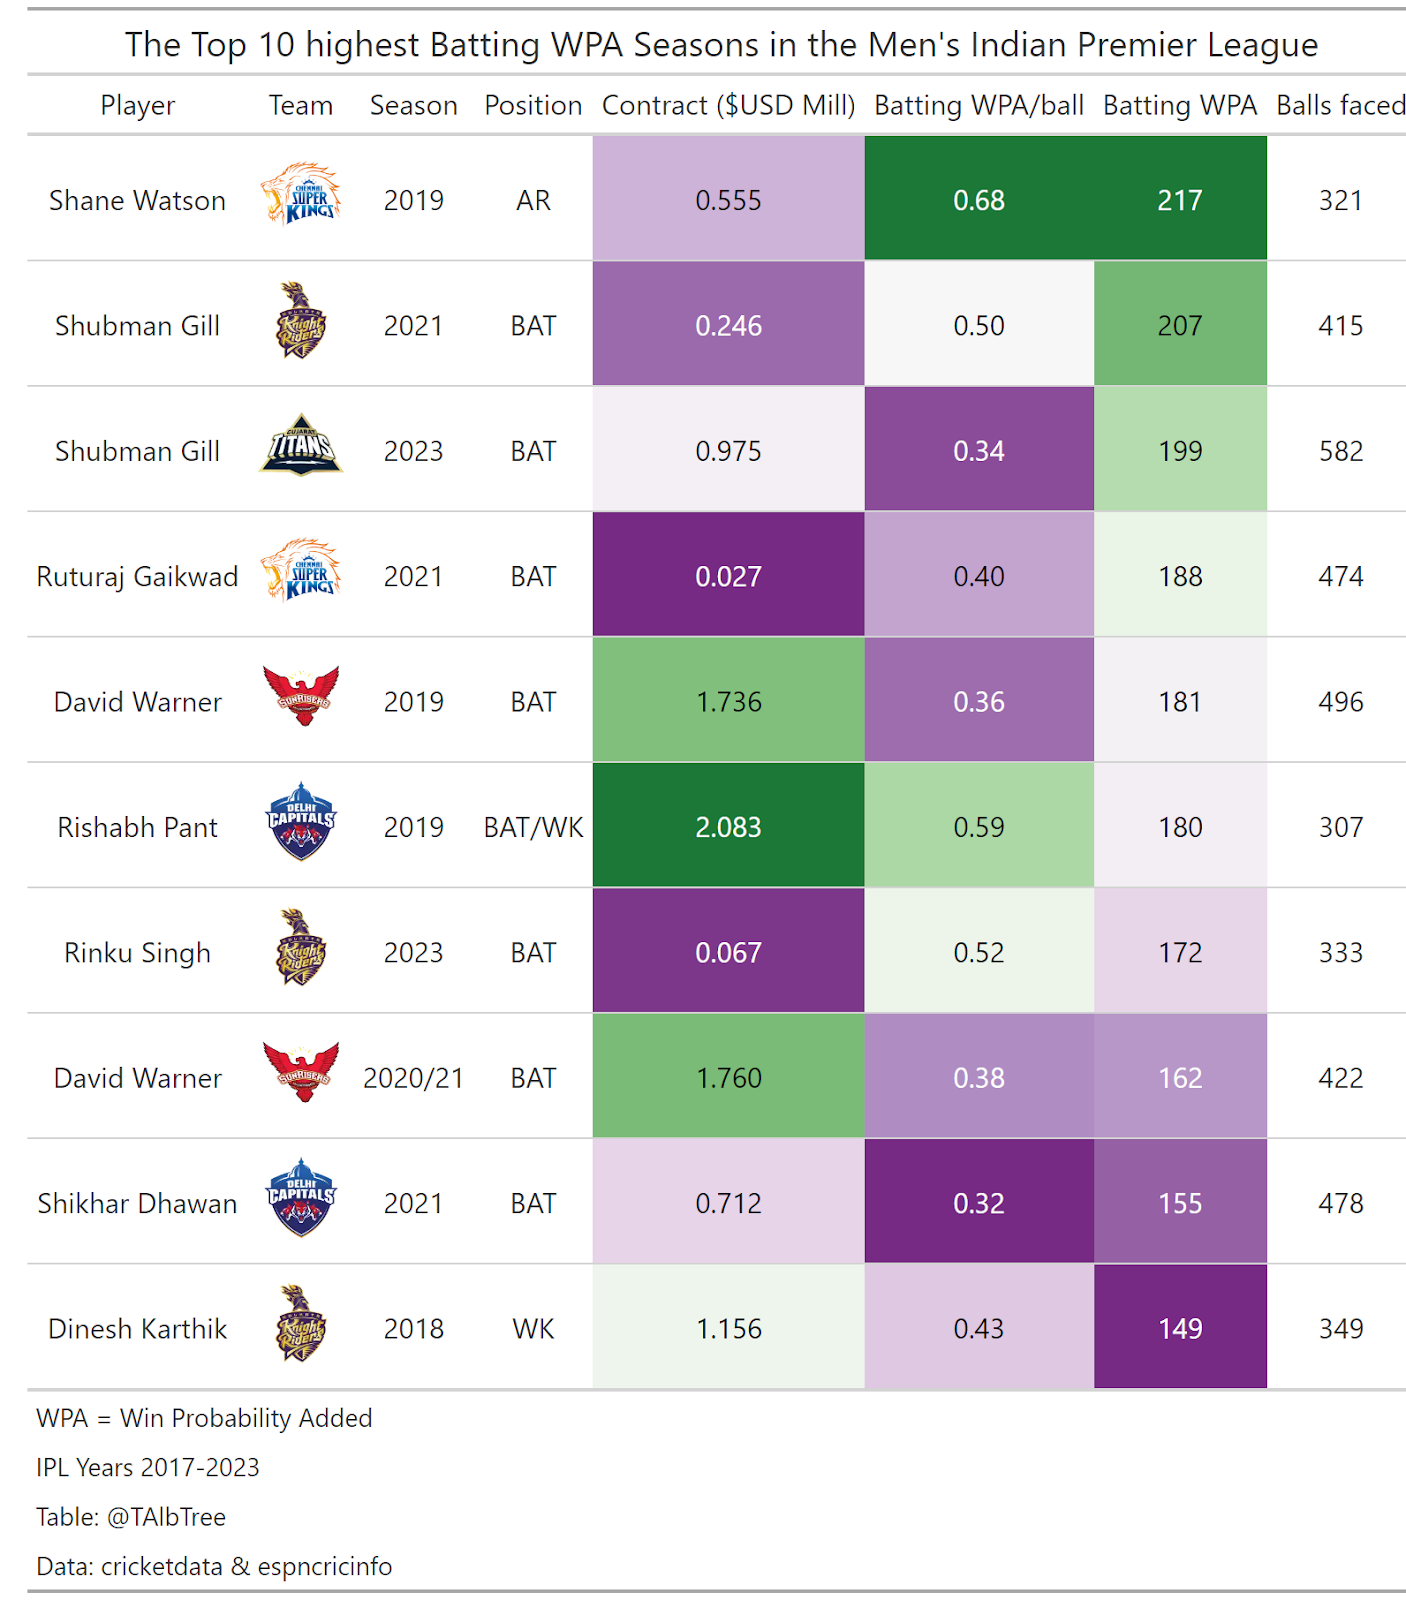
High batting WPA seasons have come from a range of contract amounts. Two of the top 10 were paid less than USD$70,000 for the season, and three were paid over USD$1.7m. The average contract of the Top 10 Batting WPA Players has been USD$931,700, this is $400,000 higher than the average of the Top 10 Bowling WPA Players.

Summary

  • Bowlers are the cheapest position in the IPL
  • Bowling WPA is slightly more correlated with Team Win Percentage than Batting WPA
  • Contract amounts are not correlated with Bowling WPA
  • Bowling WPA is not stable year to year
  • Contract amounts are not correlated with Batting WPA
  • Batting WPA is not stable year to year
  • Contract amounts have some positive correlation to Total Batting XRA, but not to Batting XRA/Ball
  • Contract amounts are positively correlated with number of balls faced as a batter, which helps explain the positive correlation of contract amounts and Total Batting XRA
  • Batting XRA has a small amount of stability year to year
  • Number of balls faced as a batter is fairly stable year to year

Further questions that need answering:

  • Why is there a correlation between IPL Contract amount and balls faced whilst batting? Are those that are paid more likely to bat earlier in the batting order?
  • Is there a correlation with Batting WPA and Batting WPA/Ball and position in the batting order?
  • Considering there is some stability of Batting WPA and XRA from year to year, is there a correlation between Batting WPA and XRA and their contract in Year N+1? This is a difficult question to answer as we would need to know when a player was eligible for a new contract – information that is not publicly available for the IPL.

Conclusion – Which positions should IPL teams pay the most? Which should they pay the least?

I’m not sure. However, I do think there presents an opportunity in the IPL for a team to attempt to “moneyball” their way to a championship without breaking the bank.

Acknowledgements

Game data was sourced using the cricketdata R package (http://pkg.robjhyndman.com/cricketdata/)

Contract amounts were sourced through ESPNCRICINFO.

Win Probability and Expected Run Models were created myself.

WR weight probably doesn’t matter

Quick blog post and data drop re weight vs performance for WRs

Dataset = drafted WRs 2010-2018 (unfair using 2019-2021 data as they haven’t had much of an opportunity to get a Top12 or Top 24 season, and the S1-3 AVG PPG PPR data would also be unfair as had only played 0-2 seasons)

Weight taken is weight whilst on an nfl roster as some of the draft weights were missing and I need to be efficient with my time. Also, didn’t use BMI as the height data was in a format I couldn’t be bothered/smart enough to translate properly into inches.

Weight vs PPG PPR S1-3 (sorry, don’t have PPR PPG longer than S1-3, as that’s all we’re kinda interested in when scouting college WRs)

R^2 = 0.005 (Weight explains 0.5% of the variance of S1-3 PPR PPG). P-value 0.329 (e.g. 33% likelihood the findings are due to chance i.e. no correlation)

Weight vs Draft position

R^2 = 0.003 (Weight explains 0.3% of the variance of Draft Position). P-value 045 (e.g. 45% likelihood the findings are due to chance)

Edit 13/1/22: Re-ran analysis but with log of draft pick (should’ve done it initially, oversight)

R^2 0.015: Weight explains 1.5% of the variance of log draft pick. P = <0.05: This is significant! It means that there’s less than a 5% likelihood the findings are chance. So we can be confident that there IS a correlation between weight and log of draft pick, in that, as weight increases, draft position gets lower (or better) however the correlation is insanely tiny.

Divided weights into 4 quartiles based off the dataset. <191lbs, 191-202, 203-215, >215lbs, as people are usually quoting weight “thresholds” that they want players to meet. I used logistic regression for the next part (helps calculate an odds ratio).

Shouldn’t really have to account for draft capital as supposedly not any correlation between weight and draft position, but I did anyway as it’s the right thing to do.

Blue circled section is weight categories 2 through 4, compared to category 1 (<191 lbs). In order for it to be a significant difference, the blue circled values need to be less than 0.05. I think given the sizes of the samples we’re using though, I’m kinda on board with having anything less than 0.10 as significant. Basically, when accounting for draft round, none of the weight categories were more likely to record a Top 24 season than the other weight categories. Category 4 (>215 lbs) is the closest to significance compared to Category 1 (Odds ratio 2.05 but 95% CI 0.6-7), so maybe there’s a trend, but who knows what we’d find with a larger dataset, could solidify significance, or it could go back the other direction.

Edit 13/1/22: Again, re ran analysis but with log of Draft Position for Top 12 and Top 24 seasons – remains nil significant odds ratios

The same was found for Top 12 seasons, however even further away from significance.

Basically, I’m still rolling with I don’t think weight really matters enough to significantly influence my opinions on a player. Except maybe Tutu, come on man, I love you, but eat a cheese burger

Efficiency matters: Proposing a new metric to measure Wide Receiver breakouts

A staple of the analytics approach to rookie wide receiver prospecting is how early the player “broke out” during his college career. Breakout age (BOA) was initially coined by Shawn Siegele and Frank DuPont over at RotoViz – with the idea of measuring the age at the beginning of the season in which the wide receiver crested 20% of their team’s receiving yards and receiving touchdowns, or dominator rating. Since then the approach has shifted to labelling a breakout once a wide receiver crests 30% dominator rating to help increase hit rate, however it also reduces the eligible player pool.

Earlier this year Anthony Amico (https://twitter.com/amicsta/status/1350426726124421120?s=21) demonstrated that years out of highschool was more predictive for seasons 1-3 PPR points per game (PPG) than age for wide receivers, and that perhaps we should be looking at breakout year (BOY) as opposed to breakout age. Finally, the argument recently has been to use weighted dominator rating to judge breakout year, which weights the players share of his teams receiving yards at 80%, and the players share of his teams receiving touchdowns to 20%. The idea being that touchdowns have a random nature to them and can be prone to regression (either positive or negative) whereas share of receiving yards is more indicative of the amount of receiving pie a wide receiver has truly earned.

Although it has provided positive signal for wide receiver success, using weighted (or unweighted) dominator rating has its flaws. It only accounts for the player’s share of his team’s production, it provides no information as to how efficient the player was in that production. 

An alternative that accounts for efficiency? Receiving yards per team pass attempt (RYPTPA) – which was summarised recently by Chris Moxley in his recent article on Jaylen Waddle (https://campus2canton.com/the-analytics-argument-for-jaylen-waddle/):

“The advantage of YPTPA is that it tries to adjust for things standard dominator and market share does not. In sum, it speaks to a player’s efficiency while accounting for volume.” – Chris Moxley

To my knowledge there hasn’t been any research into whether utilising a RYPTPA threshold has any more correlation to WR fantasy success than using dominator rating. So I went and researched it. 

The Study

My tested sample was 81 wide receivers drafted in the NFL Draft Rounds 1-3 between 2012-2018. Players were excluded if they played Junior College which muddies the data. Rounds 1-3 were chosen as they’re the primary players we are focused on in fantasy football drafts.

Campus2Canton tools indicate that in order to be above the trend line of a top 24 WR the prospect needs to hit the following RYPTPA thresholds for each year out of high school:

Year 1 – 1.43 

Year 2 – 2.03

Year 3 – 2.43

Year 4 – 2.63

For simplicity sake I simplified the first three marks to 1.5/2.0/2.5 RYPTPA.

The five breakout year thresholds I compared were:

1.5 RYPTPA

2.0 RYPTPA

2.5 RYPTPA

20% weighted dominator (WD20)

30% weighted dominator (WD30)

Using a one-way ANOVA test I measured correlation of the above 5 thresholds to Seasons 1-3 PPR PPG, and using a Chi-Square test and Phi statistic I measured the association to top 12 and top 24 seasons. I used a combination of sports-reference.com data and data from Jerrick Backous’ database.

Eta squared is the proportion of any change in S1-3 PPR PPG that can be explained by the breakout year threshold tested.

The Phi coefficient is the association between the breakout year threshold tested and whether a top 12 or top 24 year was hit. The closer to 0 is less correlation, the closer to 1 is more correlation.

All 5 thresholds had a p value less than 0.05 which indicates that there was a statistically significant difference in S1-3 PPR PPG between the different years within each threshold category. 

Out of the 5 tested thresholds for BOY, Weighted Dominator 30% (WD30) has the highest correlation to both S1-3 PPR PPG and Top 12/24 seasons, followed by RYPTPA1.5 for S1-3 PPR PPG and for a Top 24 season. RYPTPA 2.5 was the second highest for a Top 12 season.

The Proposal

Now to the meat of the article. I am proposing a new easy to apply metric which has a higher strength of association (Eta squared) than using a BOY with WD30 only, and increases our pool of eligible players. 

Combined YPTPA1.5+WD30 Breakout Years = BOY using RYPTPA 1.5 + BOY using WD30

If a player did not exceed either 1.5 RYPTPA or 30% WD during their college career then they were allocated a score of 5 for that section e.g. Amon-Ra St Brown surpassed RYPTPA 1.5 in year 1, but never crested WD30 so scores a 5 for the WD30 section, added together he scores a combined 6.

The combined metric demonstrated a higher association to Seasons 1-3 PPR PPG and Top 12/24 seasons than WD30 in both a one-way ANOVA test, and a Chi-squared test, as evidenced by the higher Eta squared statistic, and the Phi coefficients. The Eta squared of 0.384 indicates that in this sample the Combined Breakout Years of RYPTPA1.5 + WD30 can explain 38.4% of the difference in each player’s PPR PPG in their first 3 seasons.

There was a statistically significant difference in S1-3 PPR PPG between years 1, 2, and 3 compared with years 4 and 5. There was not a statistically significant difference when comparing years 1, 2, or 3, or between years 4 and 5.

There was a statistically significant difference between combined years 3, 4, and 5 compared to year 7. There was a trend towards a statistically significant difference between those years and years 8 or 9 which likely would have become significant with a larger sample of players. There was a trend toward statistical significance between combined years 2 and 7 which again likely would have become significant with a large sample of players.

The above bar charts indicate Seasons 1-5 Points per Reception Points per Game when using a BOY of WD30 or using the combined metric for Breakout Years of RYPTPA1.5+WD30. To give context, the mean PPG for the whole sample was 8.7PPG. On both charts we can actually see that a combined breakout of 2 years or a WD30 breakout of year 1 averaged less PPG than a combined breakout of 3-5 years or a WD30 breakout of year 2. For WD30 there was a clear drop in production after year 3, and for the combined years there was a moderate drop from years 5 to 6, and a steep drop from 7 years onward.

We can use the clear drop in production point from the PPG charts above for each threshold to break our WRs into two groups, and then we can also split into a third group looking at WD30 Year 2 or less as that is often utilised. 

In this sample, players that had a combined BOY of 5 years or less scored more points (11.3PPG) in their first 3 seasons than players who didn’t crest WD30 until year 3 (10.2PPG). If the player sample is limited to players who had a WD30 breakout of year 2 or earlier then we are limited to only 25 players compared to 41 players of a combined BOY of 5 years or less, yet in this sample they scored the same amount of points (11.3PPG). The WD30 3 years or less group have 7 more eligible WRs than the combined 5 years or less group but scored 0.5PPG less.

Takeaways

  • Stop using Weighted Dominator 20% for judging a breakout season
  • Weighted Dominator 30% is the most accurate single metric to judge a breakout season however it can be restrictive
  • Receiving Yards per Team Pass Attempt 1.5 on it’s own can be used as a slightly less accurate but also less restrictive single metric to judge a breakout season
  • Combining Breakout years of RYPTPA1.5 + WD30 has a higher association to success than using only WD30
  • Fade players who have a WD30 BOY of 4 or 5.
  • Fade players who have 7 or more Combined Breakout years
  • I would recommend targeting players who score 5 or less Combined Breakout years as it provides a balance between not being too restrictive whilst still maintaining high levels of association to fantasy scoring.

For the 2021 rookie class who have Round 3 draft capital or better, the players who score a combined 5 Breakout years or less are:

2 – Rondale Moore

3 – Rashod Bateman

4 – Ja’Marr Chase, Jaylen Waddle*(truncated year 3 sample), Elijah Moore, Chatarius “Tutu” Atwell, Dyami Brown