A staple of the analytics approach to rookie wide receiver prospecting is how early the player “broke out” during his college career. Breakout age (BOA) was initially coined by Shawn Siegele and Frank DuPont over at RotoViz – with the idea of measuring the age at the beginning of the season in which the wide receiver crested 20% of their team’s receiving yards and receiving touchdowns, or dominator rating. Since then the approach has shifted to labelling a breakout once a wide receiver crests 30% dominator rating to help increase hit rate, however it also reduces the eligible player pool.
Earlier this year Anthony Amico (https://twitter.com/amicsta/status/1350426726124421120?s=21) demonstrated that years out of highschool was more predictive for seasons 1-3 PPR points per game (PPG) than age for wide receivers, and that perhaps we should be looking at breakout year (BOY) as opposed to breakout age. Finally, the argument recently has been to use weighted dominator rating to judge breakout year, which weights the players share of his teams receiving yards at 80%, and the players share of his teams receiving touchdowns to 20%. The idea being that touchdowns have a random nature to them and can be prone to regression (either positive or negative) whereas share of receiving yards is more indicative of the amount of receiving pie a wide receiver has truly earned.
Although it has provided positive signal for wide receiver success, using weighted (or unweighted) dominator rating has its flaws. It only accounts for the player’s share of his team’s production, it provides no information as to how efficient the player was in that production.
An alternative that accounts for efficiency? Receiving yards per team pass attempt (RYPTPA) – which was summarised recently by Chris Moxley in his recent article on Jaylen Waddle (https://campus2canton.com/the-analytics-argument-for-jaylen-waddle/):
“The advantage of YPTPA is that it tries to adjust for things standard dominator and market share does not. In sum, it speaks to a player’s efficiency while accounting for volume.” – Chris Moxley
To my knowledge there hasn’t been any research into whether utilising a RYPTPA threshold has any more correlation to WR fantasy success than using dominator rating. So I went and researched it.
The Study
My tested sample was 81 wide receivers drafted in the NFL Draft Rounds 1-3 between 2012-2018. Players were excluded if they played Junior College which muddies the data. Rounds 1-3 were chosen as they’re the primary players we are focused on in fantasy football drafts.
Campus2Canton tools indicate that in order to be above the trend line of a top 24 WR the prospect needs to hit the following RYPTPA thresholds for each year out of high school:
Year 1 – 1.43
Year 2 – 2.03
Year 3 – 2.43
Year 4 – 2.63
For simplicity sake I simplified the first three marks to 1.5/2.0/2.5 RYPTPA.
The five breakout year thresholds I compared were:
1.5 RYPTPA
2.0 RYPTPA
2.5 RYPTPA
20% weighted dominator (WD20)
30% weighted dominator (WD30)
Using a one-way ANOVA test I measured correlation of the above 5 thresholds to Seasons 1-3 PPR PPG, and using a Chi-Square test and Phi statistic I measured the association to top 12 and top 24 seasons. I used a combination of sports-reference.com data and data from Jerrick Backous’ database.
Eta squared is the proportion of any change in S1-3 PPR PPG that can be explained by the breakout year threshold tested.
The Phi coefficient is the association between the breakout year threshold tested and whether a top 12 or top 24 year was hit. The closer to 0 is less correlation, the closer to 1 is more correlation.
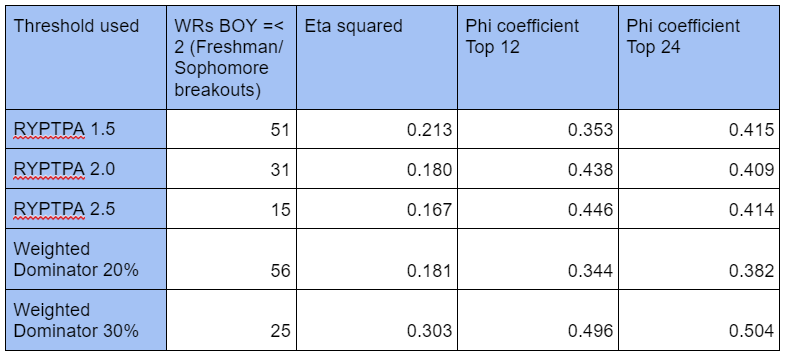
All 5 thresholds had a p value less than 0.05 which indicates that there was a statistically significant difference in S1-3 PPR PPG between the different years within each threshold category.
Out of the 5 tested thresholds for BOY, Weighted Dominator 30% (WD30) has the highest correlation to both S1-3 PPR PPG and Top 12/24 seasons, followed by RYPTPA1.5 for S1-3 PPR PPG and for a Top 24 season. RYPTPA 2.5 was the second highest for a Top 12 season.
The Proposal
Now to the meat of the article. I am proposing a new easy to apply metric which has a higher strength of association (Eta squared) than using a BOY with WD30 only, and increases our pool of eligible players.
Combined YPTPA1.5+WD30 Breakout Years = BOY using RYPTPA 1.5 + BOY using WD30
If a player did not exceed either 1.5 RYPTPA or 30% WD during their college career then they were allocated a score of 5 for that section e.g. Amon-Ra St Brown surpassed RYPTPA 1.5 in year 1, but never crested WD30 so scores a 5 for the WD30 section, added together he scores a combined 6.
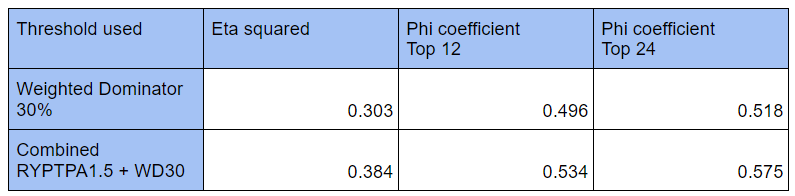
The combined metric demonstrated a higher association to Seasons 1-3 PPR PPG and Top 12/24 seasons than WD30 in both a one-way ANOVA test, and a Chi-squared test, as evidenced by the higher Eta squared statistic, and the Phi coefficients. The Eta squared of 0.384 indicates that in this sample the Combined Breakout Years of RYPTPA1.5 + WD30 can explain 38.4% of the difference in each player’s PPR PPG in their first 3 seasons.

There was a statistically significant difference in S1-3 PPR PPG between years 1, 2, and 3 compared with years 4 and 5. There was not a statistically significant difference when comparing years 1, 2, or 3, or between years 4 and 5.
There was a statistically significant difference between combined years 3, 4, and 5 compared to year 7. There was a trend towards a statistically significant difference between those years and years 8 or 9 which likely would have become significant with a larger sample of players. There was a trend toward statistical significance between combined years 2 and 7 which again likely would have become significant with a large sample of players.
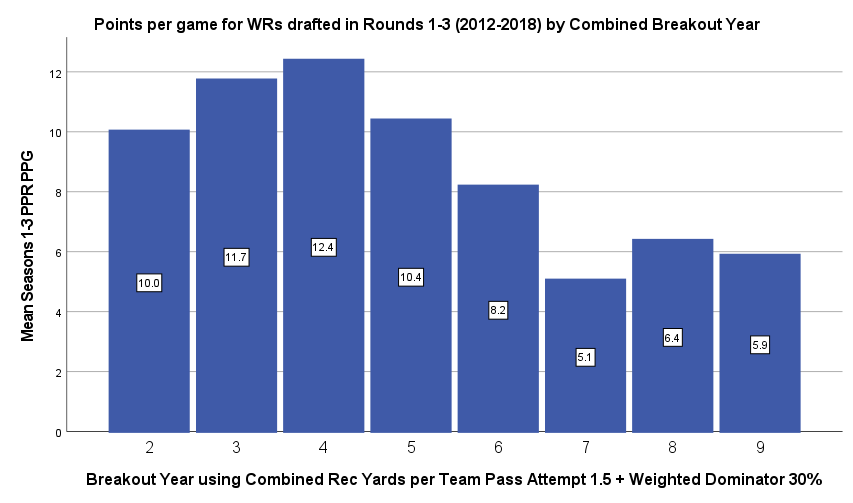
The above bar charts indicate Seasons 1-5 Points per Reception Points per Game when using a BOY of WD30 or using the combined metric for Breakout Years of RYPTPA1.5+WD30. To give context, the mean PPG for the whole sample was 8.7PPG. On both charts we can actually see that a combined breakout of 2 years or a WD30 breakout of year 1 averaged less PPG than a combined breakout of 3-5 years or a WD30 breakout of year 2. For WD30 there was a clear drop in production after year 3, and for the combined years there was a moderate drop from years 5 to 6, and a steep drop from 7 years onward.
We can use the clear drop in production point from the PPG charts above for each threshold to break our WRs into two groups, and then we can also split into a third group looking at WD30 Year 2 or less as that is often utilised.
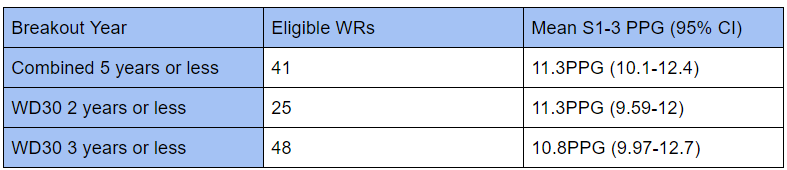
In this sample, players that had a combined BOY of 5 years or less scored more points (11.3PPG) in their first 3 seasons than players who didn’t crest WD30 until year 3 (10.2PPG). If the player sample is limited to players who had a WD30 breakout of year 2 or earlier then we are limited to only 25 players compared to 41 players of a combined BOY of 5 years or less, yet in this sample they scored the same amount of points (11.3PPG). The WD30 3 years or less group have 7 more eligible WRs than the combined 5 years or less group but scored 0.5PPG less.
Takeaways
- Stop using Weighted Dominator 20% for judging a breakout season
- Weighted Dominator 30% is the most accurate single metric to judge a breakout season however it can be restrictive
- Receiving Yards per Team Pass Attempt 1.5 on it’s own can be used as a slightly less accurate but also less restrictive single metric to judge a breakout season
- Combining Breakout years of RYPTPA1.5 + WD30 has a higher association to success than using only WD30
- Fade players who have a WD30 BOY of 4 or 5.
- Fade players who have 7 or more Combined Breakout years
- I would recommend targeting players who score 5 or less Combined Breakout years as it provides a balance between not being too restrictive whilst still maintaining high levels of association to fantasy scoring.
For the 2021 rookie class who have Round 3 draft capital or better, the players who score a combined 5 Breakout years or less are:
2 – Rondale Moore
3 – Rashod Bateman
4 – Ja’Marr Chase, Jaylen Waddle*(truncated year 3 sample), Elijah Moore, Chatarius “Tutu” Atwell, Dyami Brown
